Wow, that was a webinar! Commodities Countdown Webinar 2016-10-27. I spent a lot of time explaining breadth measurements. If you have not used the Bullish Percent Indexes (BPI's) to help understand market breadth this will be an important webinar to review. For more information on the background of BPI's check out this great article written by Arthur Hill.
Here is a good example. The Bullish Percent Index for the Nasdaq 100 ($BPNDX) is usually one of the strongest BPI's. Notice the note that I wrote in the callout box in May 2015. The market was hitting new highs but the Bullish Percent Index had dropped to 63. After the $NDX made new highs earlier this week in October (Gray shaded area with a black line on top), the $BPNDX (Blue line) is at 63% after being at 79% in July. The lime green horizontal line reflects the current level for the $BPNDX. The market is bullish when it can get above the red lines and cautious when it stalls below the lower red line. One has to be aware of the precarious level.
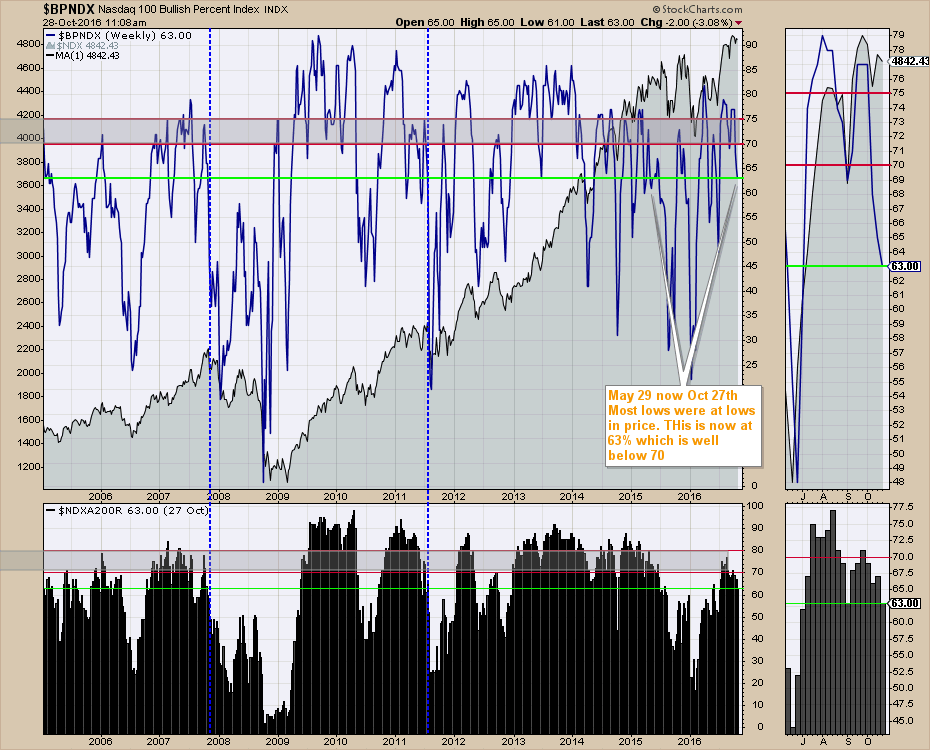
Staying with the chart above, the percentage of stocks above the 200 DMA ($NDXA200R) shown in the bottom panel is also breaking down. When I read this chart, I want to see the market push this indicator well above the lower red line. When it is above the top line, the market is making a massive bull run. When it has been above the lower red line and recedes back under, it is a small warning that the market breadth is narrowing. The point of having all the history on the chart is to understand how the market stays bullish, then starts to weaken.
After being up in the red zone, we are currently at the level of 63. One of the concerns around this level, is there are cliff walls on the chart that start around here. As the market weakens, eventually sellers overtake the buyers and the market falls on its own weight. We stand on the black precipice.
It is this alignment between the Bullish Percent and the % of stocks holding above the 200 DMA that makes this a critical place on the chart. The Bullish percent index stays on a buy signal until it makes a lower low which gives it a wide range. The percentage above the 200 DMA is a line in the sand. It is a yes/no level. This gives these breadth indicators room to move. When they both coincide with weakness, the message this week to the investor is to be aware that the final high might have been on Tuesday. Or the market could wiggle higher, with fewer stocks participating. At this point, I view this chart as a bearish omen.
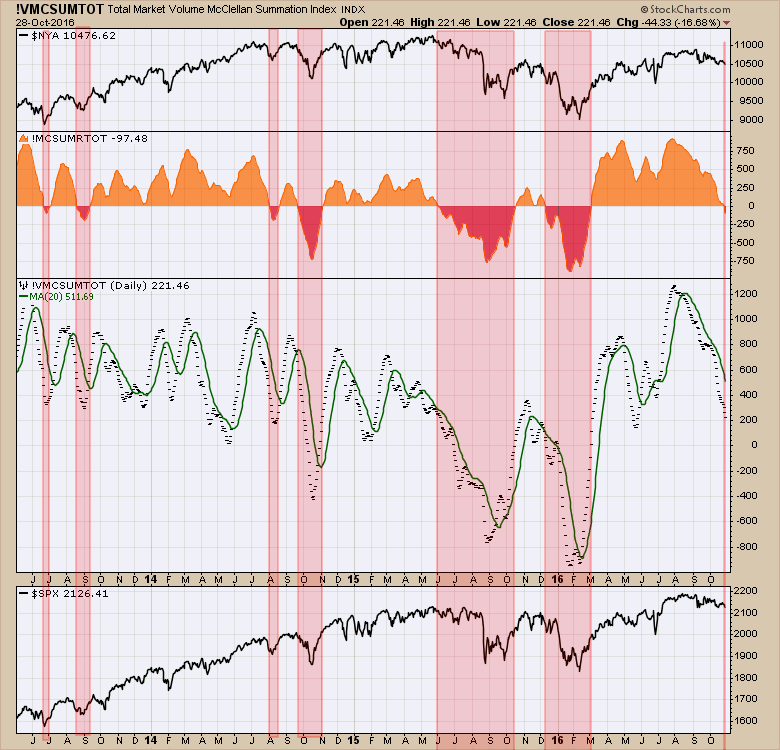
Another example is the Summation Indexes. This is the total market and the total volume summation index. All of the moves on the second panel generated meaningful breakdowns in the market. I have shown the New York Composite ($NYA) on top and the $SPX on the bottom. The negative reading for the Total Summation Index (!MCSUMRTOT) just started three days ago. The idea to use the Total Market Summation Index for variety came through my twitter feed so a Hat tip to @HansMrkts.
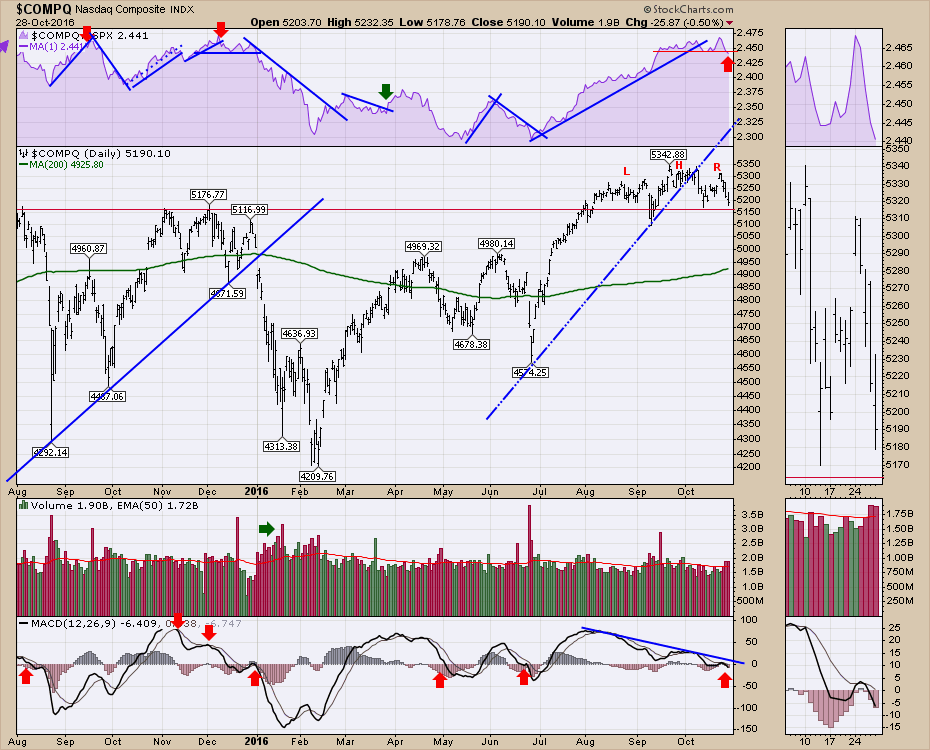
Another example is the distribution day count. A distribution day is a day where the market closes down more than 0.2% on higher volume. When you get 6 distribution days over a 4 week period, the market is probably weak enough to sell off. Currently, we have six days with a red volume bar in the zoom box that are higher than the previous day. Five of those had price changes greater than 0.2%. Three of the last four days had escalating volume while we sold off. The MACD has closed the week below zero and at its lowest level since July. On the same chart, we can see the Relative Strength in purple broke below the horizontal red trend line indicating the $COMPQ is starting to underperform for the first time since late June. Looking back, those have usually indicated larger pullbacks.
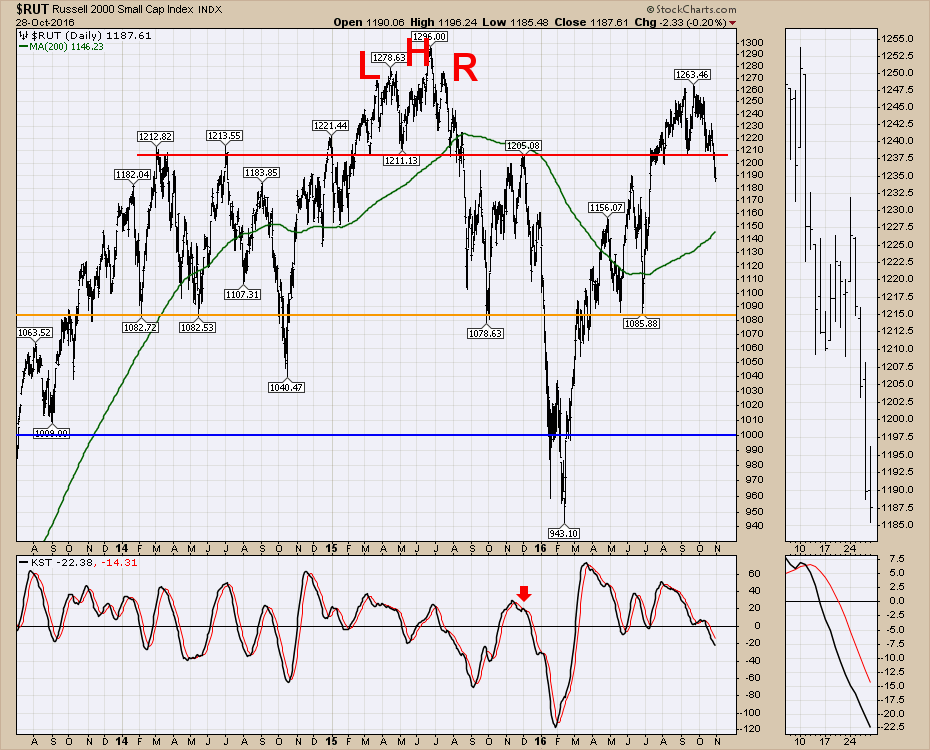
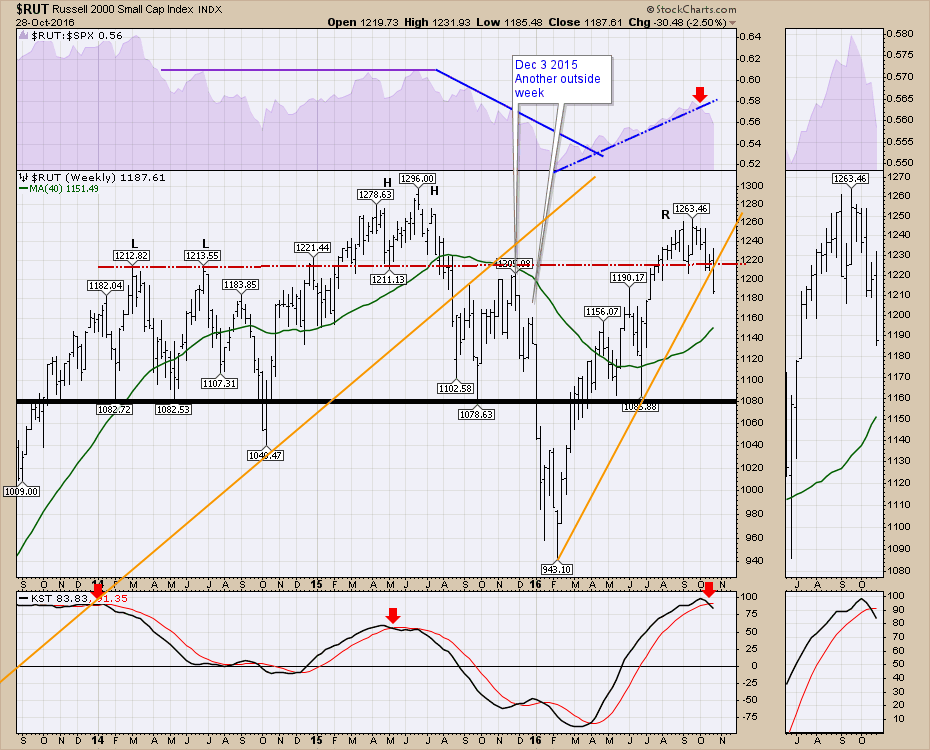
 The Russell 2000 ($RUT) is also breaking down. This index has zero gains over the last thirty months. The recent breakout above the red line resistance was important. Now that appears to have failed to hold as support. It also looks like a failed retest of the highs much like the $SPX. More on the $SPX later.
 Here is the Russell 2000 ($RUT) on a Weekly chart. The Relative strength broke in early October. The KST gave a sell signal this week.
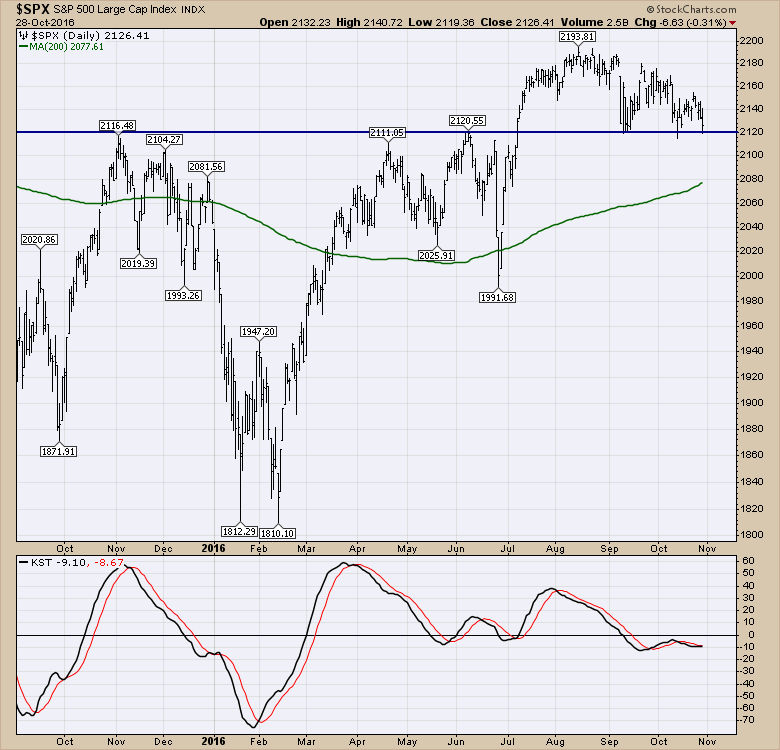
 For the $SPX, this week's price action was particularly uncomfortable. We closed very close to the support /resistance line. With the KST already negative, this was continuing the weak price action. We are now testing this support level for the third time.
 The webinar covered off a lot more information. I would encourage you to pull up a glass of your favorite beverage and take the time to see the explanation on the Commodities Countdown Webinar 2016-10-28. There is also some information on the gold and oil trades.
Good trading,
Greg Schnell, CMT, MFTA.
