Commodities were flat this week, but some of the charts are reaching levels that investors should be stalking new entries. In commodities, I look for commodity related trades that are setting up technically. While the US Dollar can't make up its mind on direction, there may be hope for another run in energy related stocks. It is still early, but there is a compelling chart in my chartlist that has identified the coming low as a great place to look for long positions.
I have shown this chart occasionally over the last year, but we are starting to see another set up opportunity in the coming quarter. Now is the time to hunt, not buy according to this chart.
The chart is of the bullish percent index for energy stocks. You can see the price labels but I have made the actual data invisible. The reason is that the data shoots from top extreme to bottom extreme and the chart is unusable in that form with this time history. However, the data creates an interesting MACD pattern which is the gem in this case and allowed us to find the bottom for the oil stocks in July 2017.
The first thing to notice is the oil industry seems to have this three year cycle (1999,2001*, 2005, 2008, 2011, 2014, 2017)in momentum that bottoms out in a major way once every three years. After having an initial blast, we also notice the MACD puts in a secondary low roughly 9 months to 18 months later. So just when everyone gives up on the sector again, the real buying starts in earnest and can be the major kickoff point for the second half of the three year cycle.
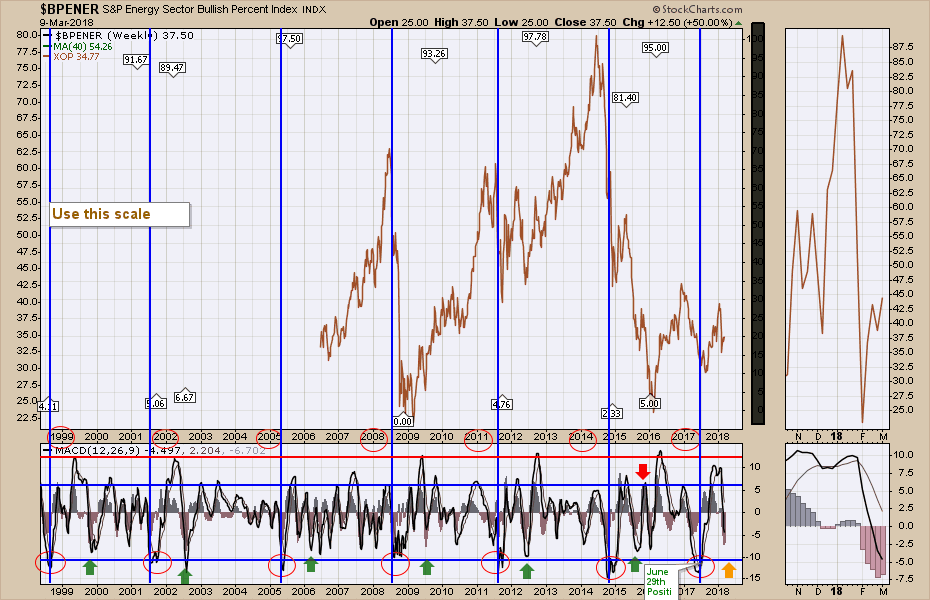
I have used the XOP oil and gas exploration ETF to find big swings in the oil stocks. With the big swings in oil stock prices, buying near a low is helpful. At this point it is still early, but we should start looking for a low in the second quarter. After the MACD is below -5, the meaningful turn back up could occur. Looking in the zoom box on the right, we are approaching the -5 level with the black line. All that to suggest, this deep momentum dive can actually be a nice buying opportunity as shown by the green arrows.
At a recent presentation I was asked if I do any fundamental analysis to confirm my opinion on stocks. While many people like to have a story for a stock, I usually find I don't trade the stock very well if I am using the CEO to guide my direction. A great example of a fundamental story is Apache. They found a huge onshore oilfield in 2014. They kept it quiet and bought up all the land around while the price of oil was plummeting back in 2015 and 2016. Now that the price of oil has doubled from the 2016 lows of $30 to $60 and remains near two year highs, you would expect Apache to be one of the strongest stocks around.
Apache has an outstanding field within the Permian, which is one of the best reservoirs, as well as great pipeline access and more. The early March 2018 stock price low is near the lowest price in 10 years! Obviously, investors are finding something else they don't like about the stock. What someone else is currently willing to pay for the shares is the best guide of corporate performance because we expect to sell the shares to someone else.
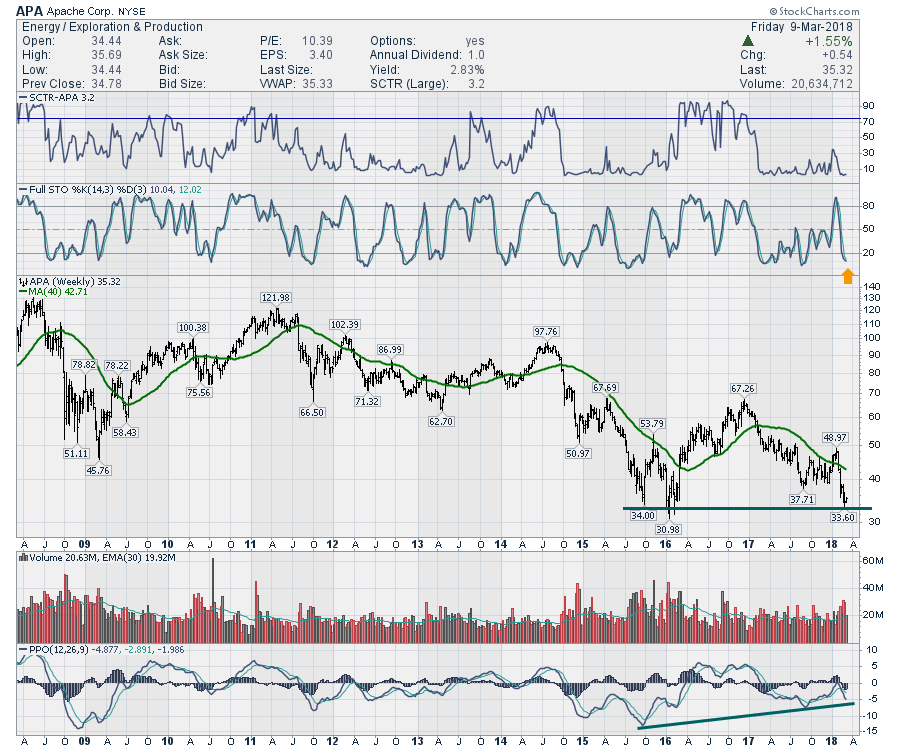 If Apache was to bounce here, there would be good technical reasons to take a position on the long side with a tight stop. First of all, we can buy at support. Secondly, there is an uptrend in momentum that has not broken yet(MACD line). Thirdly, we also had the highest volume in 18 months which might suggest a selling climax. Lastly, a stop loss could be put very close to the entry price.
Again, all that to suggest that the energy sector has sold off. The Bullish Percent Index chart as described above might be suggesting we are near a major low in momentum. My advice would be to start looking closely at the charts rather than giving up on them. Obviously, the weak ones will continue to be weak. While I don't think the industry is ready to be a buy yet, it makes sense to start browsing for some good technical setups.
Below is a current look at the commodities as we head in to a new week.
I also recorded a market outlook on the weekend. That recording can be found here. I already received email compliments on that recording, so you may wish to check it out.
Good trading,
Greg Schnell, CMT, MFTA
