Well, another challenging week for Commodities investors. A sudden surge in the $USD early in the week sent gold traders reeling and industrial metals trading pondering the recent breakouts.
I have shown the UUP where you can see the large gap early in the week. As the Dollar approaches resistance, this week will be filled with some volatility.
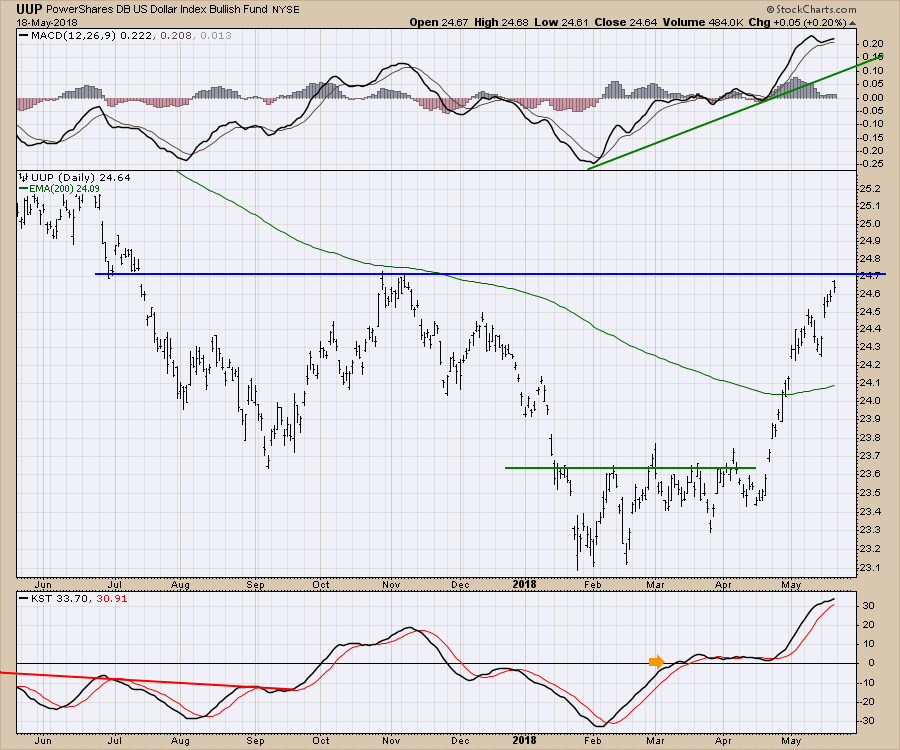
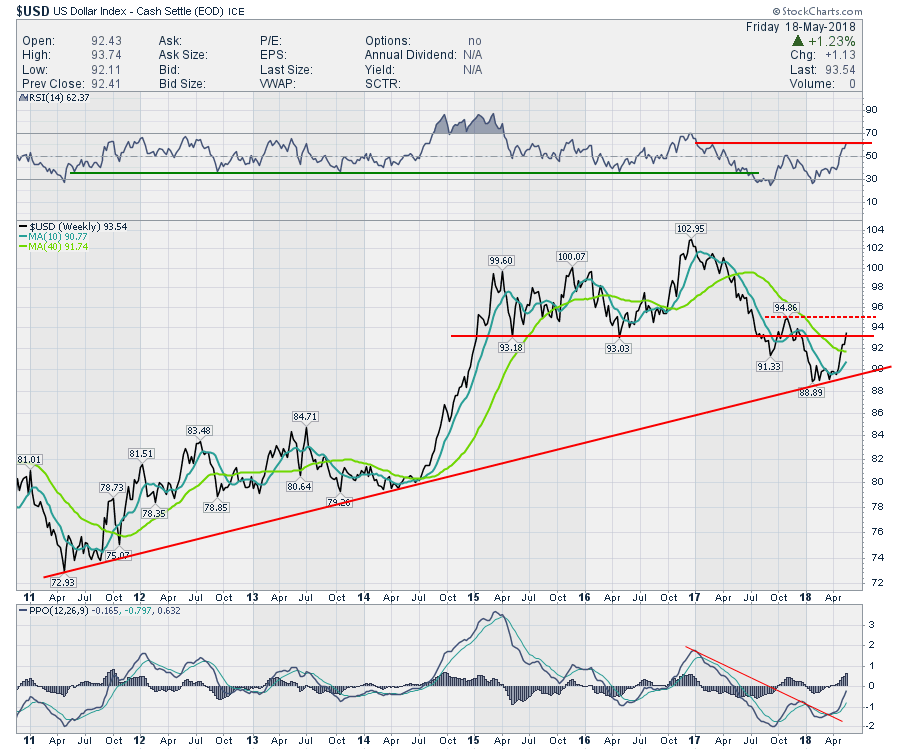
On a bigger scale, the level the dollar is currently approaching is very important. You can also see the 94.86 level that is shown on the UUP chart above in November.
 Needless to say, until the direction of the dollar becomes clear at this point, it should make for some volatility in commodities. I referred to it last week as the Battle Royale. That still seems appropriate.
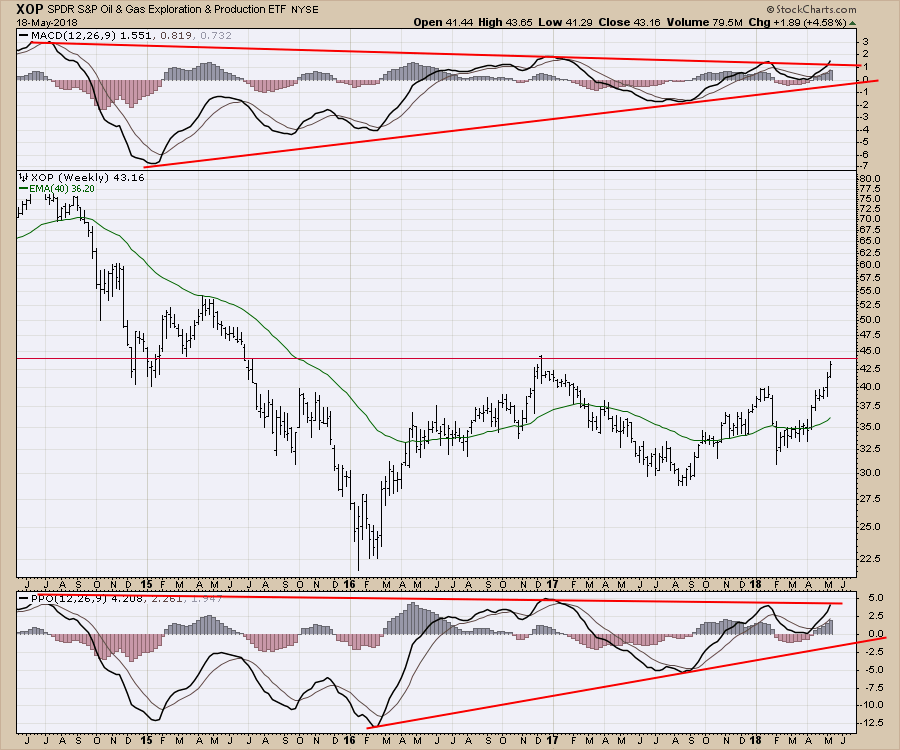
Oil continued to get a bid up under 1%, but the Exploration and Production ETF (XOP) soared 4.5%.
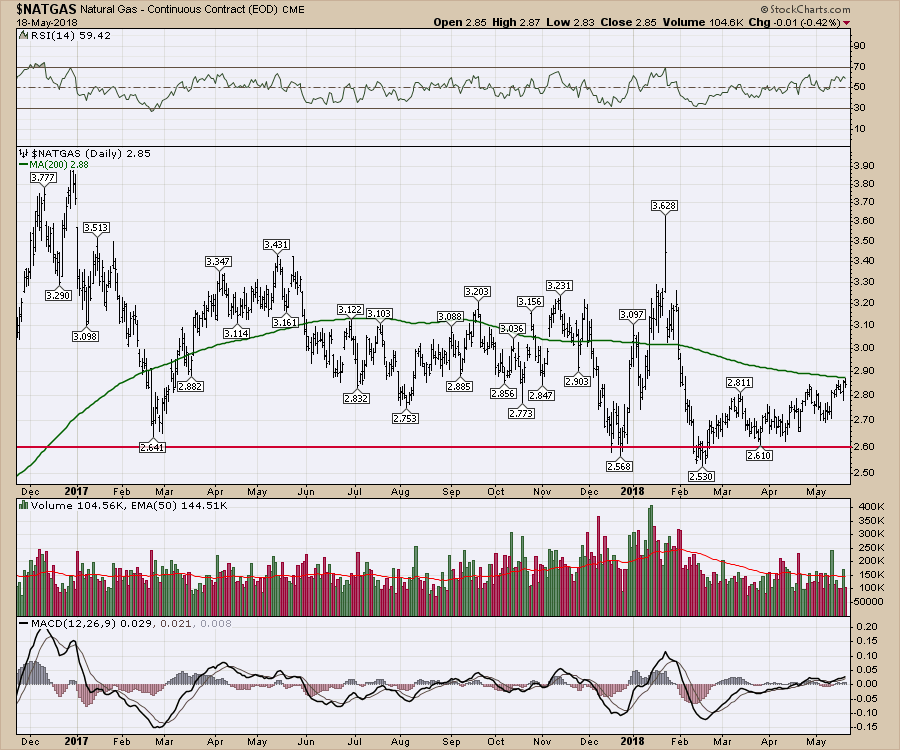
 Natural Gas has actually somewhat of an uptrend, trading near three month highs. Time to focus in here as it approaches the 200 DMA. The 200 DMA has been a pretty good support resistance level as once it moves above it seems to try and hold above as shown in November and January. Should be a good week to see if price can rally and hold above.
 As I write this I am on vacation in Greece, and the wifi is extremely slow. I recorded a video yesterday and I have spent the better part of a day trying to upload the video file. If I can get it uploaded, I will post a new article. For this week, the direction of the US Dollar will be playing havoc with commodity related trades.
I did suggest that Gold may put in an interesting bottom this week in an blog article I wrote on the Don't Ignore This Chart article list. Gold Bottom. If the price action plays out the way gold has traded on the last two lows, we could see a meaningful rally of 4-6 weeks. This would provide a fantastic entry with a superb tight stop.
I host a new TV show on StockCharts.com called The Final Bar. It airs Thursdays at 5 PM ET and is repeated throughout the week on StockCharts TV. You can also catch it on my Vimeo channel or on the StockCharts.com YouTube Channel.
Good trading,
Greg Schnell, CMT, MFTA
Senior Technical Analyst, StockCharts.com
Book: Stock Charts for Dummies
Twitter: Follow @Schnellinvestor
