 Over the decades there are a few things that have attached themselves to technical analysis that bother me. Actually, they really don't bother me; what bothers me is when I hear someone talk about what great tools they are. It is very clear to me then, that they don't use real money in their work. Warning! This article is loaded with my personal opinions and I'm positive will cause some to be upset. Please don't; this does not mean I am right and you are wrong, it is just my opinion. You can tell that this concerns me when I spend the first paragraph apologizing ahead of time. Guess that just comes with age; as an old fighter pilot I am amazed at myself for caring so much. <grin> I truly do not want to offend anyone intentionally but I just can't sit by and listen to someone tout magic as if there is substance.
As I have stated earlier I believe technical analysis is much more art than science; the science part is more related to the process of research than the actual analysis. A lot of esoteric analysis(?) has attached itself to technical analysis, probably because they involve numbers or charts. A few have reached an almost religious state among its followers. Before moving forward with this section, I adamantly want to state that with technical analysis being essentially an art; then almost anything goes as long as the user is comfortable with it. Bottom line is that if it works for you, go for it. I guess the engineer in me wants to ensure the methods I use are based upon sound and reasonable principles and at most, don’t violate any principles of analysis that I believe in. Isaac Asimov was one of my favorite authors, scientists, and researchers. In an article entitled, The Relativity of Wrong, he used the curvature of the Earth to help explain how differences in perceived facts should be held.
“When people thought the Earth was flat, they were wrong. When people thought the Earth was spherical, they were wrong. But if you think that thinking the Earth is spherical is just as wrong as thinking the Earth is flat, then your view is wronger than both of them put together. The basic trouble, you see, is that people think that "right" and "wrong" are absolute; that everything that isn't perfectly and completely right is totally and equally wrong.” - Isaac Asimov
In Nate Silver’s book, “The Signal and the Noise,” he shows concern about the honest evaluation of the performance of predictive models. We keep being bombarded by stories of data mining, when the facts show that most statistical models have high rates of error, especially true in modern finance. This does not mean they are not useful, but they have a quantifiable chance to fail. If someone is mathematically inclined such as an engineer or a scientist, then I think the probability of them using technical analysis in its purest form (first order) is more likely than when someone from the arts uses it. While the following comments on various elements of technical analysis (second order) cause me concern, it shouldn’t bother you if you disagree on my interpretation of their merits, only the realization that you and I disagree. And remember, that is what makes a marketplace.
Bold Statements about an Indicator’s Value/Worth
An issue that is bothersome is when someone makes the statement that an indicator is not any good because they have back-tested it. Well, therein is a big problem because not everyone uses an indicator the same way. You cannot judge an indicator’s usefulness for someone else, only yourself. As an example, I use Stochastics more as a trend measure and normalization measure whereas I think the majority uses it as an overbought oversold indicator. I also always use stops instead of a reversal signal of the indicator that gave the buy signal, many do not. Therefore, when you hear someone make a bold statement about an indicator’s worth; ask them for very specific details on how they tested it. Or, better yet, just ignore them.
Fibonacci Numbers
Please be seated! Often a simple mathematical series of numbers can sometimes get misinterpreted (promoted) to be something magical. My personal favorite sequence is 6, 28, 496, 2520, 8128, and 24601. I’ll explain them at the end of this section. Personally, I see no value in the actual numbers that make up the Fibonacci series; a series developed by an Italian mathematician (Fibonacci) in the thirteenth century to help understand the propagation of rabbits. First I must say that I do see minimal value in the ratio of the numbers that are expanded in a Fibonacci-like series (0, 1, 1, 2, 3, 5, 8, 13, 21, 34, 55, 89, …). That ratio is 0.618 (and its reciprocal is 1.618), often called the golden ratio because of its wide occurrence in nature; usually with a jaundiced eye. Here is a fact: the actual numbers in the Fibonacci series have nothing to do with the ratio. Any two numbers expanded in the same manner will produce the same ‘golden’ ratio. Here is a test: Try it with 2 and 19 (note that 19 is not in the supposed series). Add them together, and then add the total to the previous number just like in the Fibonacci series (2+19=21, 19+21=40, 21+40=61, etc.). Expand this until you get to four digit numbers so that the accuracy will be acceptable (2, 19, 21, 40, 61, 101, 162, 263, 425, 688, 1113, 1801, 2914, 4716, …). The last two numbers in this sequence are the two numbers that I will use for this example: 2914 and 4716. Now divide the first number by the second number and you will get 0.618. Wow! This is exactly the same as with the value obtained using the Fibonacci series of numbers. So why did I pick 2 and 19 for this example? Hint: the second letter in the alphabet is B. What is the nineteenth letter? S. BS! And that is what numerology is all about.
![]() This is the Fibonacci expansion formula.
This is the Fibonacci expansion formula.
I can find no source that explains why the series of Fibonacci numbers begins at zero. Fibonacci himself, started with 1. Zero existed back then but wasn’t widely used in mathematics. If I were tasked with mathematically identifying the propagation of rabbits, I think I would at least have to begin the series at 2. I suspect Fibonacci was considering pairs of rabbits. The fact of the matter is that the series can begin anywhere, even negative numbers as long as the expansion follows the correct formula which is 1 plus the square root of 5, all divided by 2. So, when you hear someone say they are going to use a 34 day moving average because 34 is a Fibonacci number, you can immediately begin to doubt the rest of their analysis. Nothing is wrong with using 34, it is their reason that is flawed. Just so you know I’ll repeat this; the Fibonacci expansion of one plus the square root of five divided by 2 will work with any two numbers, even negative numbers. Sorry, no magic here, just numerology.
As far as the religion of Elliott Wave theory goes, there are often so many complications and conditions introduced into using this type of analysis, that it is incapable of being proved wrong. Sometimes I think it gets adjusted more often than earnings estimates. However, it is always convincing to align the workings of the market with what appears to be pure mathematics. In the series of numbers introduced at the beginning of this section, 6, 28, 496, and 8128, are known as perfect numbers; this means the sum of their divisors (other than the number itself) is also equal to the number. For example: 6 = 1 + 2 + 3, and 28 = 1 + 2 + 4 + 7 + 14. I like 2520 because it is the smallest integer than is divisible by all integers from 1 to 10 inclusive. Finally, I like 24601 as it is the prisoner number of Jean Valjean from Victor Hugo’s Les Miserables. Incidentally, 24601 has prime factors of 73 and 337. I like these numbers solely for their mathematical uniqueness; and like many number sequences, they have absolutely no use in technical market analysis. Possibly Keno!
Retracements
Many use the Fibonacci ratio(s) for percentage retracements. These retracements are generally derivations and powers of the expansion formula one plus the square root of five divided by two. They are generated by looking at ratios of the supposed Fibonacci numbers themselves, such as dividing any number by the one that immediately follows it, which yields the ubiquitous 0.618. The complement of that is 0.382 which can also be found by dividing any number in the series by the number two places later in the sequence. 0.236 is often used as it is created by dividing any number by the number that is three places later in the series. I have often wondered where the 0.50 ratio came from; it is just the ratio of the second (1) and third (2) number in the supposed series (1/2 = .5 = 50%). At least the other percentages occurred throughout the series. I’m not sure that this process could ever end. Add to the Fibonacci retracements, those of Edson Gould which were 33% and 67%, and all of a sudden, with some percentage of error involved, you have covered over 50% of the entire data being analyzed – a coin toss would be as good if not better. I could carry this further by adding the retracement values of others; Gann comes to mind. The bottom line is simply that with enough percentage retracements provided, one of them is bound to be close to a reversal point, however, you won’t know which one it is until you invoke hindsight. And that would occur too late to make a real trade. When someone pops up a chart that shows a retracement ensure they are mentioning at which level the retracement will occur. Normally, you only see these charts after the fact. Chart A is an example of what was discussed above; who can tell me where the retracement will occur? And the Fibonacci lines were drawn in late July (blue oval) so nothing has worked yet. Thankfully, StockCharts.com does not include the 23.6% line; a number divided by a number three places higher. I attempted to draw it and it is the one not labeled. Where will this end? And remember StockCharts.com is here to provide all the tools without bias; I’m here to hopefully make you think through some of the more esoteric “stuff” that has attached itself to technical analysis.
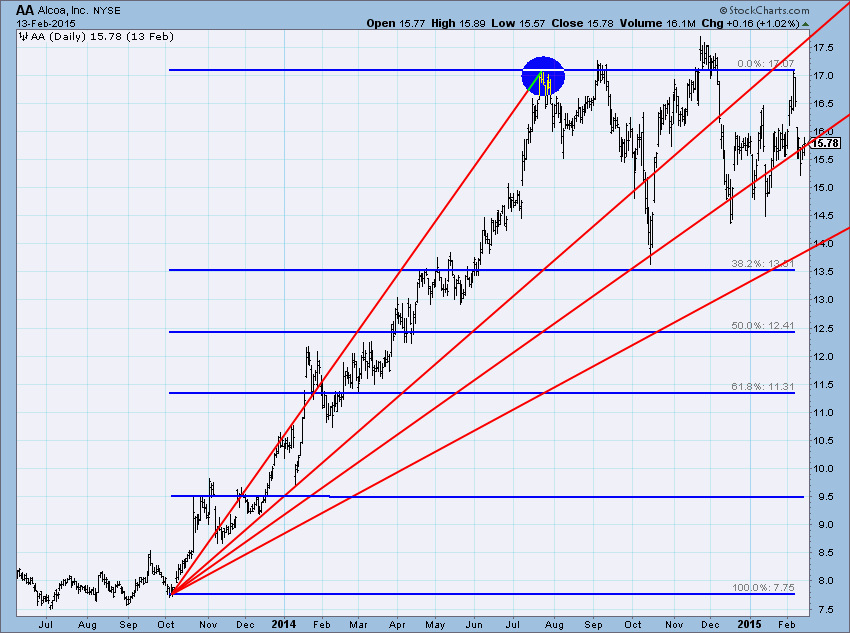
Chart A
And finally, no indicator is right all of the time; fortunately you don’t have to be right all of the time. You just need to ensure that you do not hold onto losers and keep your emotions out of the game. Choose some good reliable indicators and stick with them. Learn how they respond during different market environments and master the interpretation of them. And remember, when your favorite indicator fails you, avoid thinking that this time is different, it probably is not. And the bottom line is this – if you use these esoteric methods profitably, then more power to you. No storytelling now, it has to be with real money.
I have more, but that's enough for now; if I have any readers remaining I will do the others at some point.
Trade with Understanding,
Greg Morris
