 I had another article planned but think writing about something that just occurred in the market is a much better learning/teaching experience. Trend following has one issue that will constantly plague the investor and usually at the least expected time, and that is whipsaws. I must admit, I think it just takes experience to get used to whipsaws, if you ever do. I hate them, but I also know that trying to adjust a model based upon sound principles so that the whipsaws in the recent past are reduced or eliminated will lead to two things: one, the performance in the past will probably be reduced, and two, you have probably reduced the performance going forward; more than likely without changing the overall number of whipsaws. Trying to eliminate whipsaws will often create more of them and at the worst time – going forward.
2017 was a wonderful year for trend following and many other strategies. Probably the one strategy that did not do as well might have been market timing. By market timing I mean the attempt to get out at the top and get in at the bottom. I tried that decades ago and will never attempt it again – too expensive.
Chart A is an example of a whipsaw like my model just experienced. The Nasdaq Composite peaked on January 26th and began a significant sell off. My holdings hit their stops on February 2nd (blue arrow), but it was in the last hour of the day and I do not trade in the first or last hour of the day (one of my rules). Hence, I sold on February 5th immediately after the first hour of trading (red arrow). For the next 4-5 days being in cash was rewarding. Then the market turned around and my trend following indicators began to improve and last Friday, February 23rd, my asset commitment level put me back in at 20% of portfolio value (green arrow). Again, after the first hour of trading. I never break the rules I spent decades creating – NEVER.
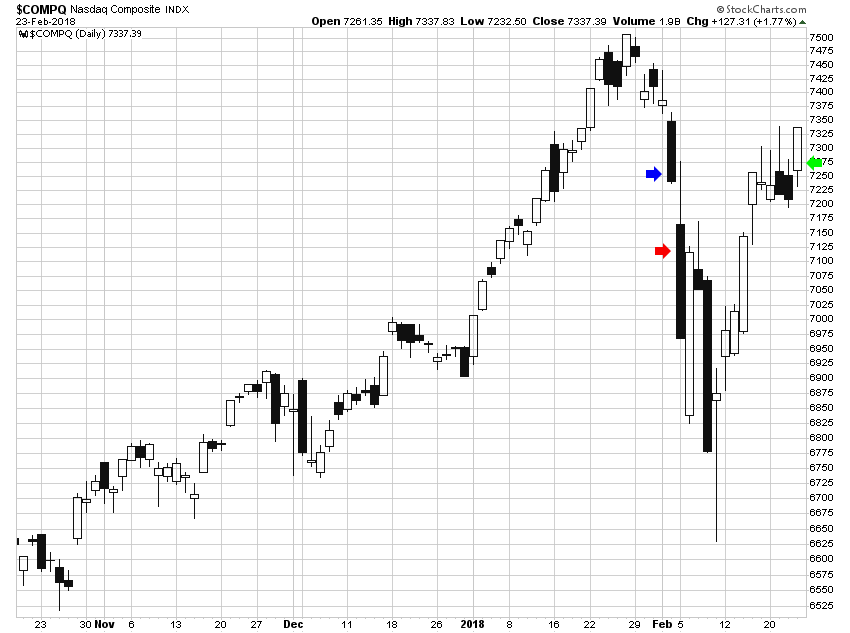 Chart A
Figure B is an illustrated example of a whipsaw like I just experienced. The market is rising, has a pullback so that stops are hit and then shortly thereafter reverses to the upside. The trend following measures take a while to adjust to the quick change in market direction and eventually if the rise continues, I start getting back in. I call this an “Up Market Whipsaw.” The red dot is when you sell and the blue is when you buy back in.
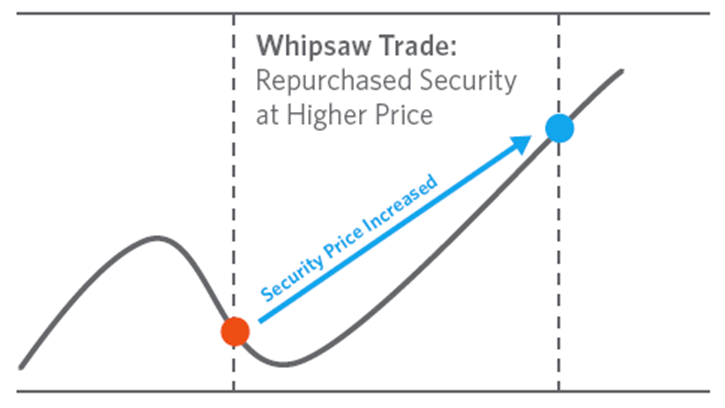 Figure B
Remember, hindsight can cause you to see things that are not visible as the market plays out. Did I lose money on this? Of course I did, but only the amount based upon the stop loss level I had. After that I did not lose money, but lost opportunity. I got back into the market only partially, above where I was fully stopped out. And don’t forget, the jury is still out on the future of this market. The worst-case scenario would be for me to eventually get fully invested again and then the market heads south. And believe me, I have experienced those before; the last half of 2011 was the worst 6 months ever in my model.
This all goes along with my series on Building a Rules-Based Trend Following Model, but I get tired of using the same title for the articles. Whipsaws must be accepted to be a successful trend follower. I have learned to live with them; sadly, newcomers to the market have a really difficult time accepting them. They usually let a little hindsight sneak in. If you are going to use a model, then follow it. In anticipation of being asked what I think the market will do from here; I offer my usual response: I have no idea, and no one else knows either.
Dance with the Trend,
Greg Morris
