DecisionPoint June 25, 2014 at 02:56 PM
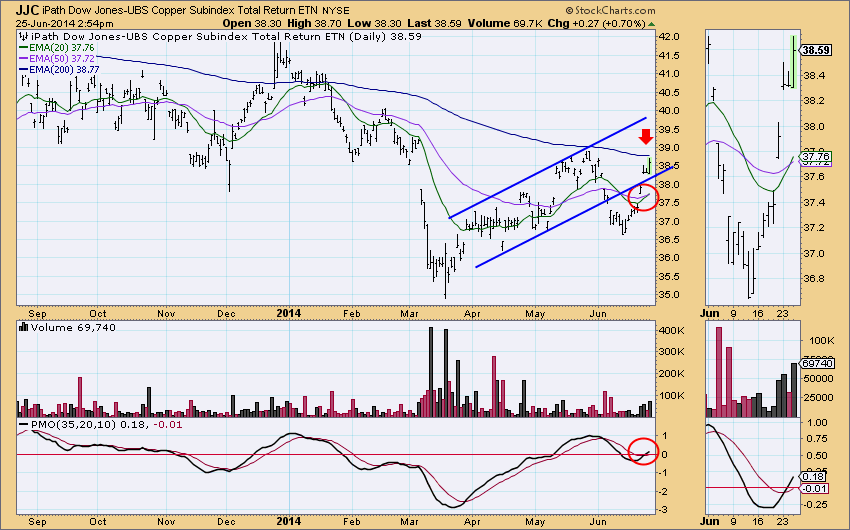
The two cornerstone indicators for DecisionPoint analysis are the PMO and the intermediate- and long-term Trend Models... Read More
DecisionPoint June 19, 2014 at 06:20 PM
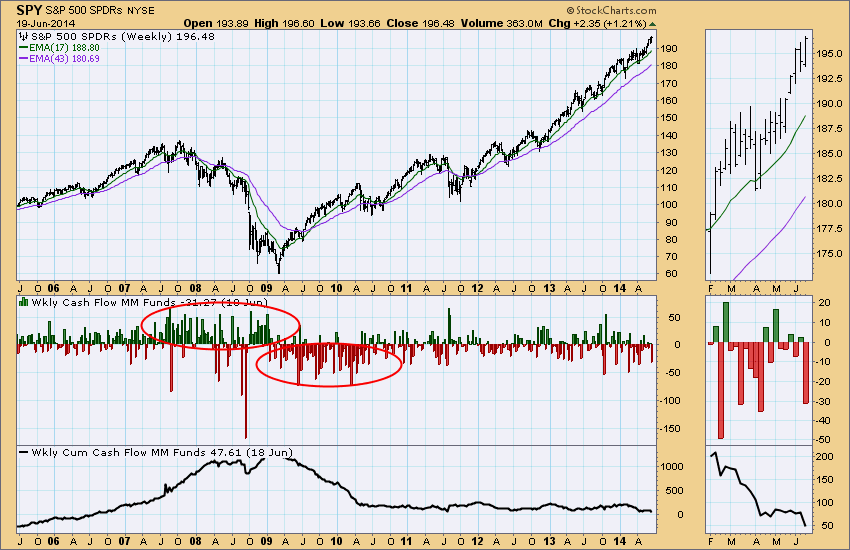
One of the data sets we keep is Money Market Mutual Fund Weekly Net Cash Flow, published on ICI.org. It is a sentiment indicator that allows us to watch short-term sentiment, as well as sentiment trends... Read More
DecisionPoint June 16, 2014 at 07:38 PM
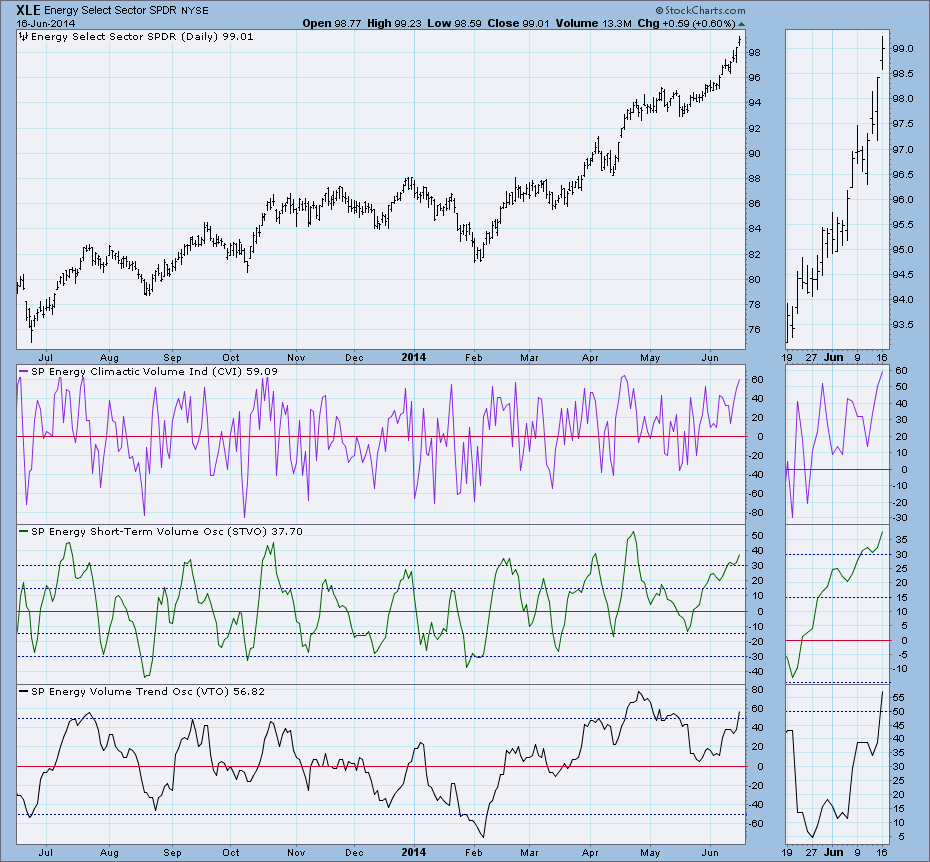
The DecisionPoint On Balance Volume (OBV) indicator suite consists of three related indicators: Climactic Volume Indicator (CVI), Short-term Volume Oscillator (STVO), and Volume Trend Oscillator (VTO). All of these indicators are derived from the basic OBV calculation... Read More
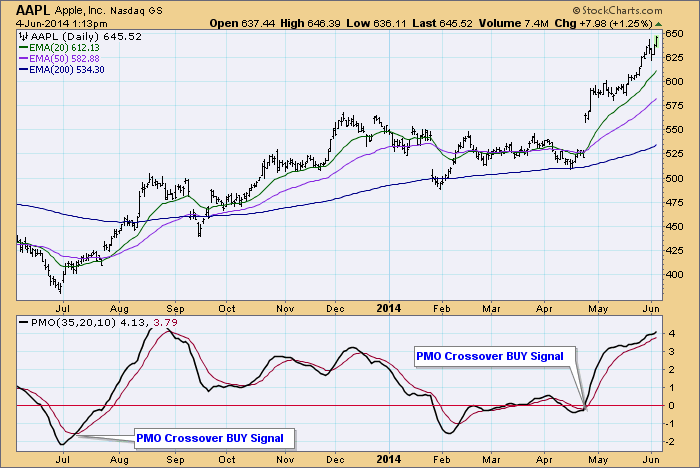
DecisionPoint June 12, 2014 at 03:01 PM
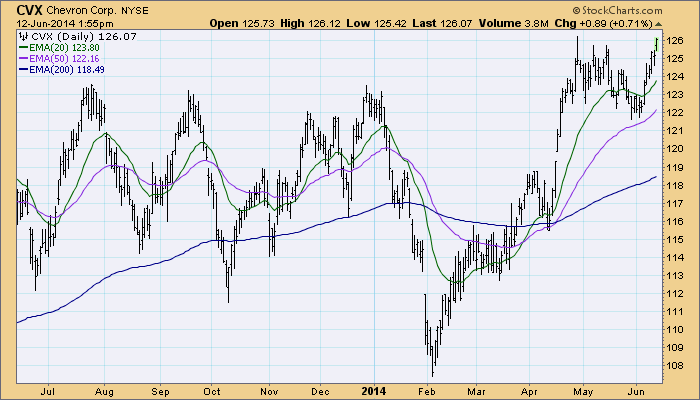
A useful and basic technique for deciding if a stock is bullish or bearish to observe the relationship of price to its moving averages... Read More
DecisionPoint June 10, 2014 at 02:45 AM
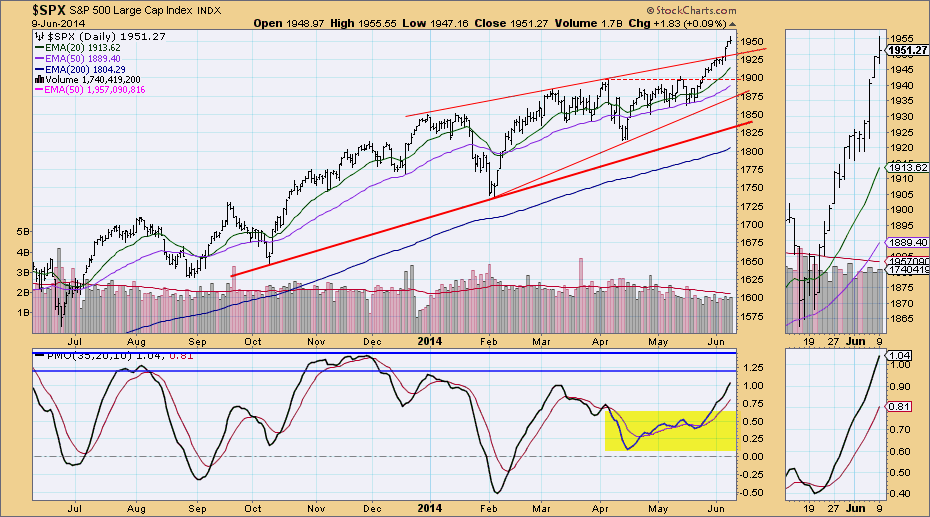
For some time, our intermediate-term indicators have been oscillating in a tight range. But since the breakout rally began, readings are now setting themselves apart. Let's look at a few charts from the DP Chart Gallery. First is the daily chart for the SPX... Read More
DecisionPoint June 04, 2014 at 02:45 PM
The Precentage of Stocks on PMO Crossover Buy Signals is flashing a warning on three of the indexes we track in the decisionPoint Alert Daily Report... Read More