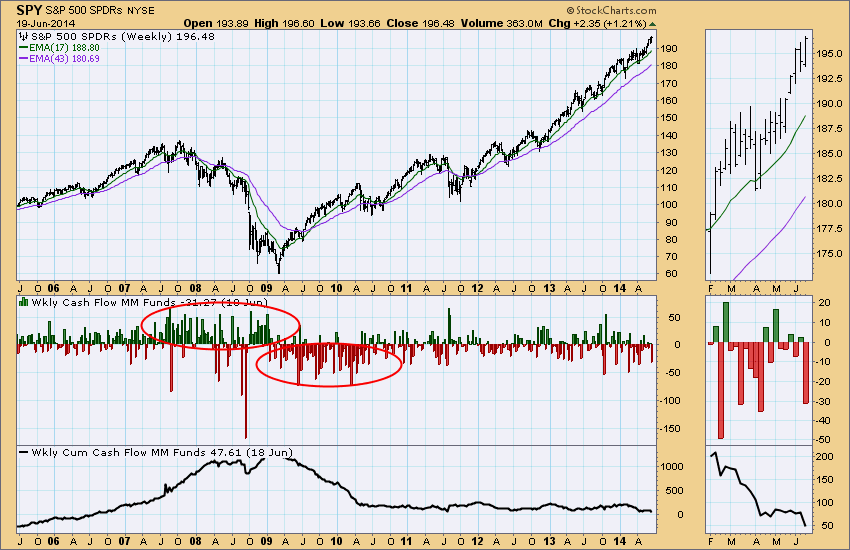
One of the data sets we keep is Money Market Mutual Fund Weekly Net Cash Flow, published on ICI.org. It is a sentiment indicator that allows us to watch short-term sentiment, as well as sentiment trends. The histogram on the chart below reflects the weekly cash flow in billions, the red bars representing cash moving out of money market mutual funds, which is an expression of bullish sentiment, because it is assumed that much of that cash is going into stocks. The green lines represent cash flow into money market funds, an indication of bearish sentiment, negative for stocks.
We can see that there were steady inflows during the 2007-2008 financial crisis, then changing to steady outflows as the bull market got under way in 2009-2010. Finally, in the last four years inflows and outflows have been about equal. This week's outflow was a reflection of bullish sentiment due to positive price action.
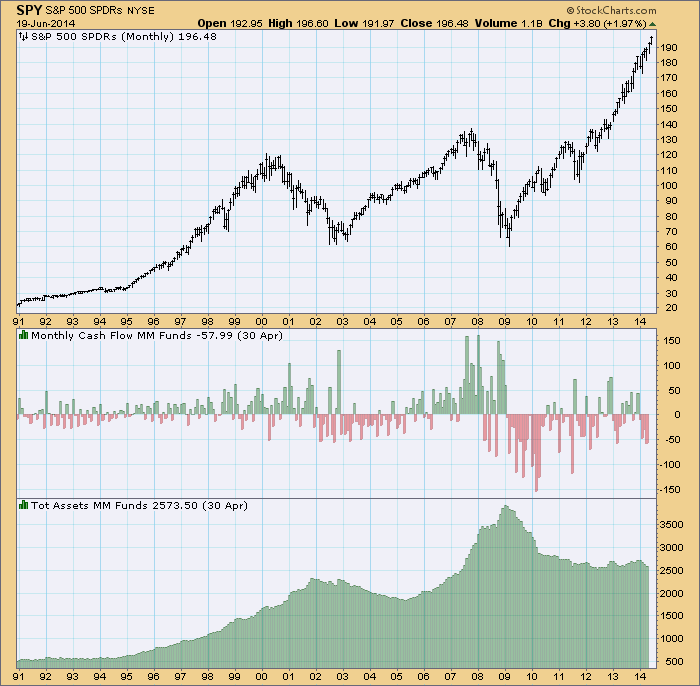
A companion chart shows monthly net cash flow and money market cash flow levels. (These data are published one month in arrears.)
Conclusion: There was a rather large outflow from money market mutual funds this week, showing how positive price action pushes sentiment to the bullish side. This year cash flows have been predominantly out. We would want to watch for a reversal of that trend.
