The DecisionPoint On Balance Volume (OBV) indicator suite consists of three related indicators: Climactic Volume Indicator (CVI), Short-term Volume Oscillator (STVO), and Volume Trend Oscillator (VTO). All of these indicators are derived from the basic OBV calculation.
On-Balance Volume was invented by the late Joe Granville. It is a basic analysis tool that is available for you to use on the SharpCharts workbench. An OBV index is created by adding or subtracting the day's volume to a cumulative total based upon whether the stock closes up or down in the day. Click here to read a more complete article on OBV.
To construct the DecisionPoint OBV suite of indicators, the OBV for each stock in a given index is calculated. The information is summarized and calculated into the actual indicators, currently available for the SPX, OEX, NDX, Dow and 9 Sectors. These indicators are related by the same basic OBV calculation so they can be presented together on the same chart for a view of conditions in three different time frames.
I took a look at this set of charts using the "DPMI - 1030 - OBV Indicator Set (CVI/STVO/VTO)" ChartList from the DP Market Indicators ChartPack. Below is my analysis of what is being revealed by the OBV Indicator Suite.
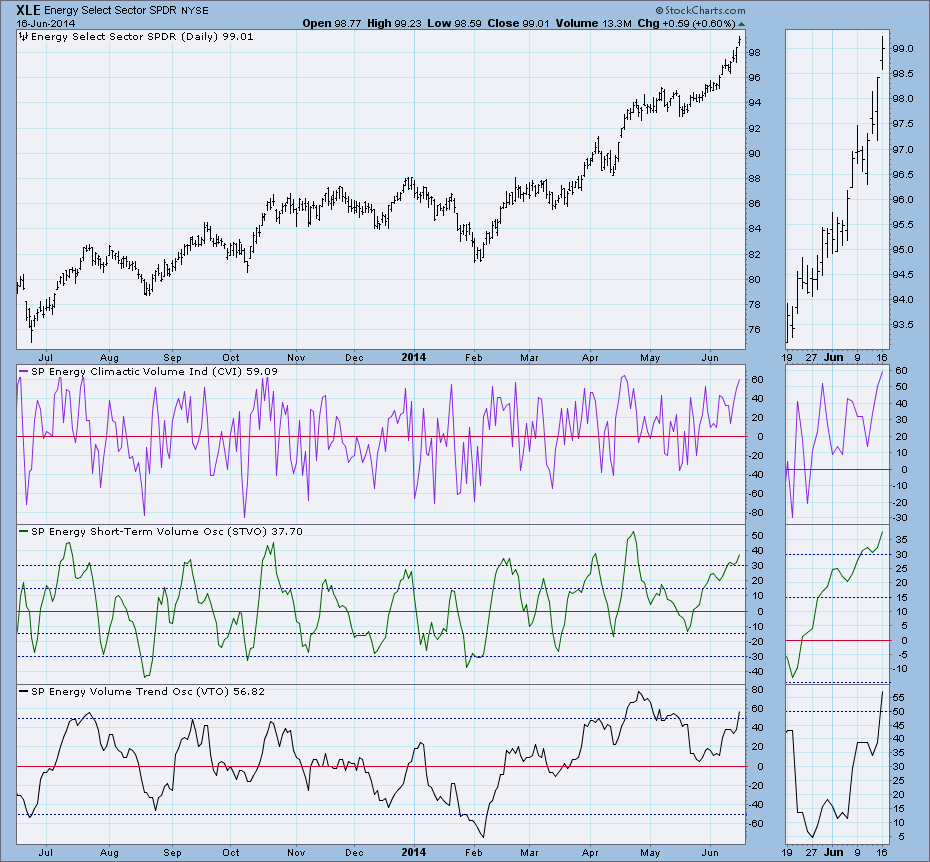
Probably fueled by the concerns regarding Iraq, XLE has enjoyed a steep rally. In the ultra-short-term, the CVI moved climactically to the top of overbought territory. This looks like a possible initiation climax. I say this because the STVO and VTO both have not reached the top of their range so they could support higher prices.
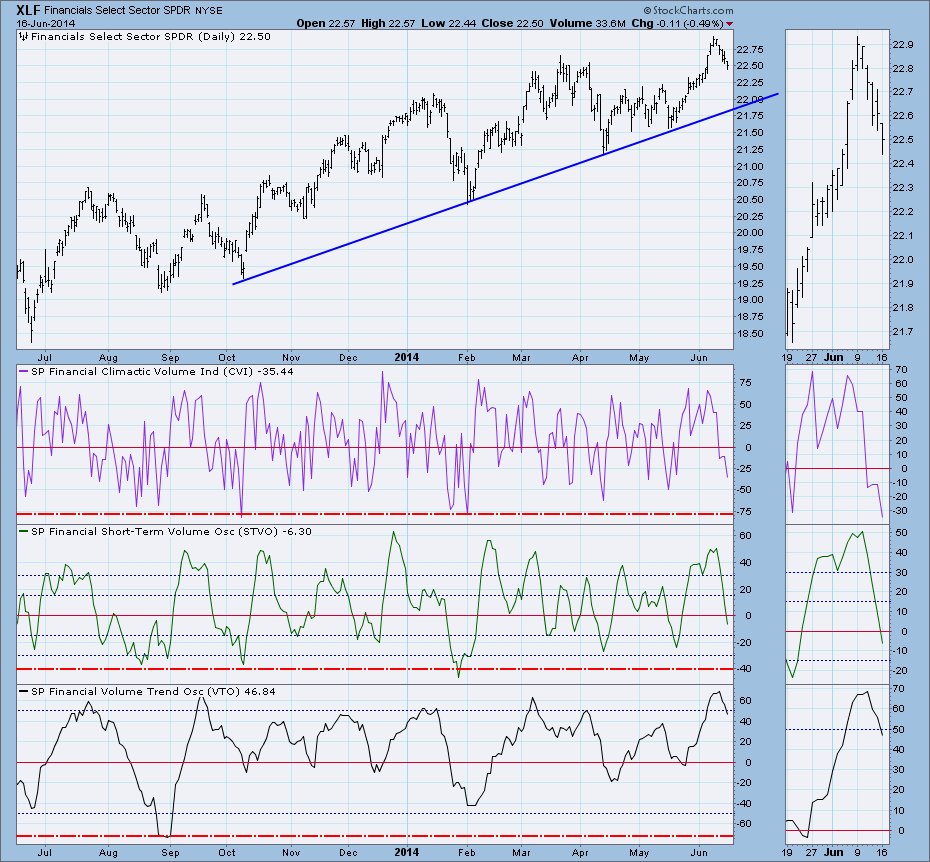
In the case of the Financial ETF (XLF), it has been on a slide. It hasn't hit support yet, the CVI and STVO have just about reached overbought extremes, but the VTO has more unwinding to do and it needs lower prices (or consolidation) to do this. The configuration suggests more decline.
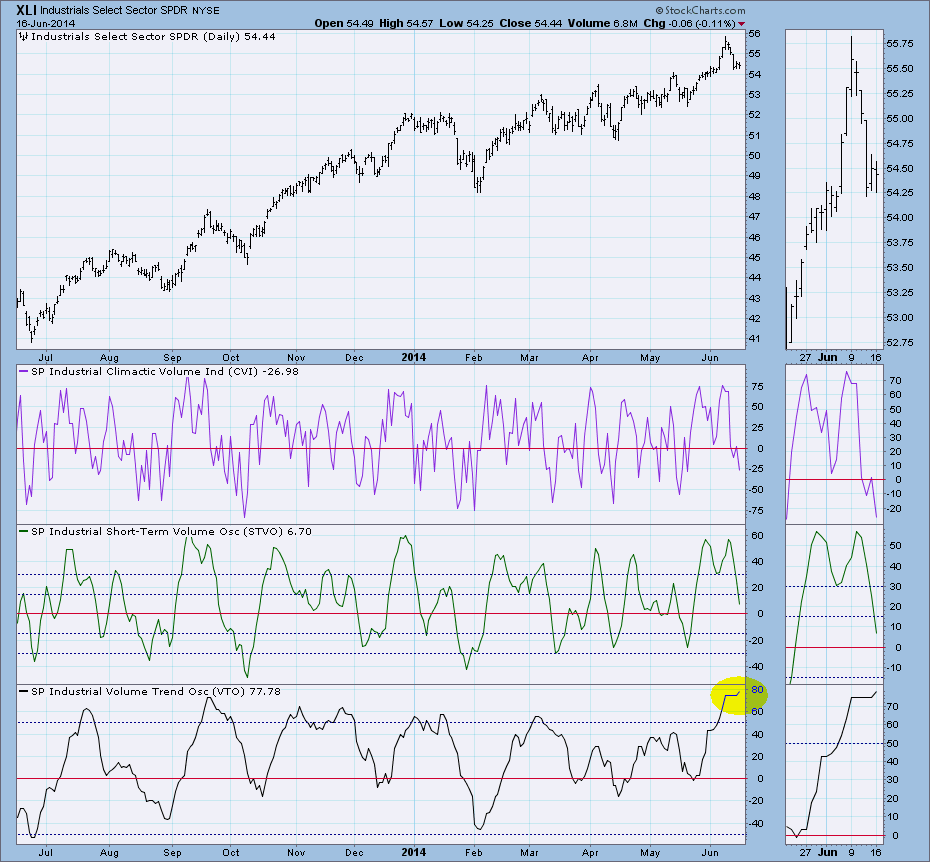
XLI is starting to form a possible reverse flag. It's easier to see in the thumbnail. This is short-term bearish. The VTO has hit very extreme readings and today was up, it is very overbought. Meanwhile the CVI and STVO are both neutral as readings have been dropping. The VTO really needs to let off some steam soon and the price pattern usually results in lower prices. The CVI and STVO could stand to move lower.
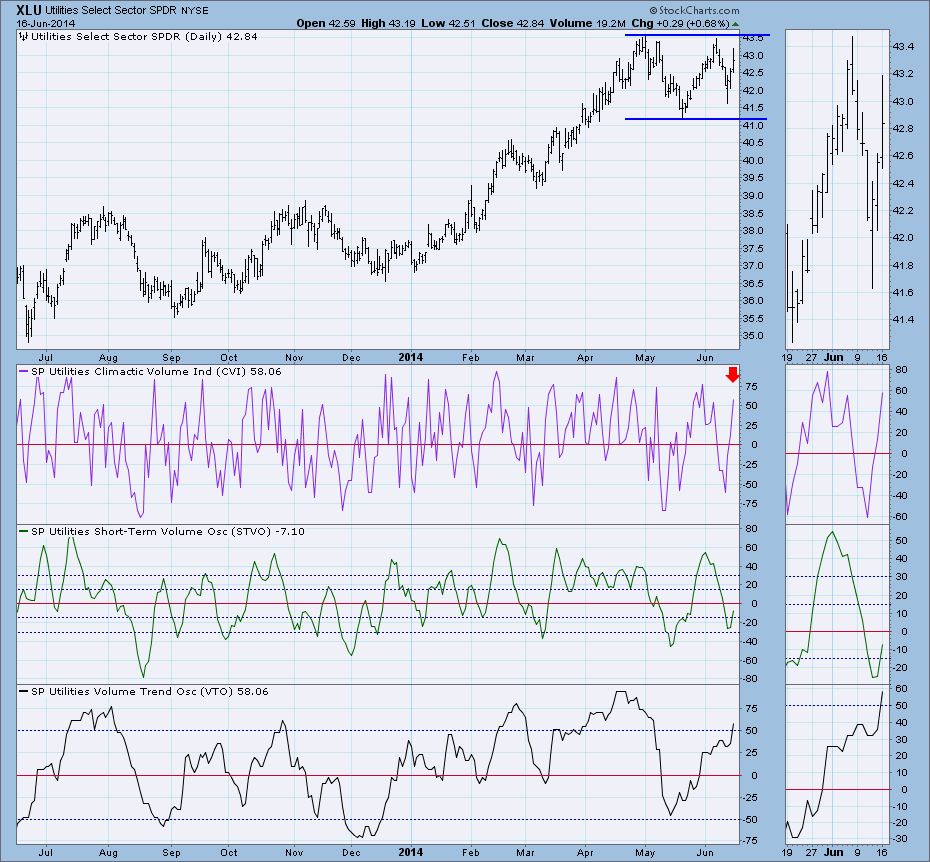
The Utilities Sector (XLU) has been oscillating and its last bottom didn't reach horizontal resistance at the May low. I think that is bullish. Although price is closing in on overhead resistance, the CVI made a climactic move higher today which could be read as an initiation to higher prices based on the STVO bottoming in somewhat oversold territory and just hitting neutral, and the VTO, rising through overbought territory, still has plenty of room to move higher before reaching extremes.
These charts can be read different, but I hope that my analysis helped you to better understand the OBV Indicator Suite.
