Standard & Poors has just finalized the S&P 500 earnings for the first quarter of 2014, and although there is some talk of an equities bubble, the market is merely overvalued. The following chart shows the S&P 500 with bands that show where the index would be if it were overvalued (red), undervalued (green), or at fair value (blue). Historically price tends to drift back and forth between the top and bottom of the range, although, the period shown on the chart is hardly typical.
When the S&P 500 was topping in 2000, it had gotten far above the overvalued level with a P/E of about 45, in a market that was said to be driven by "irrational exuberance". Price did not get back within the normal range until 2005. Then during the financial crisis the value bands collapsed due to a 2008 fourth quarter loss of -23.25, which rendered the value range useless for a year until the loss dropped out of the calculations. Since 2010 the normal relationship between price and the earnings bands has been restored, and we can have more confidence in what we see.
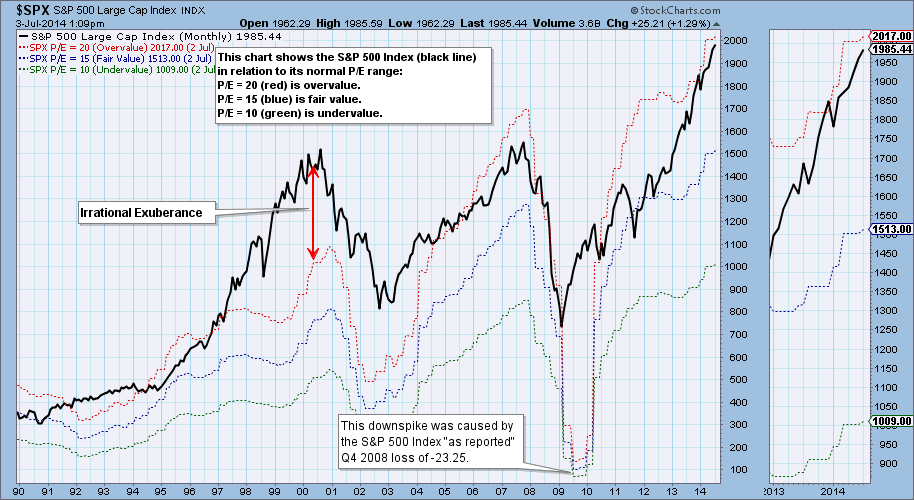
Currently the S&P 500 is near the top of the range and is overvalued, and based upon this fact, we should consider the market vulnerable to correction on the basis of its fundamentals; however, a correction is not the only possible outcome. For example, earnings could continue higher, and price could follow along.
Conclusion: The P/E of the S&P 500 is just under 20, which is overvalued and makes the market vulnerable; however, there is no evidence on this chart that there is an equity bubble.
Happy Independence Day!
- Carl
