I actually review most of the charts in the DP Chart Gallery for my DecisionPoint Daily Update everyday, but there are a few that I don't often survey. With the market correcting, bottoming and today, pausing, I wanted to see all of what we have in the Chart Gallery and the story the charts are telling. I'm glad I did as there are definitely some interesting configurations on many of the indicator charts. I'll examine four right now, but I highly recommend you go take a look at the entire Gallery to give you an even more complete picture.
The main theme of all of these charts below is that we have intermediate-term bottoms on indicators that appear to coincide with significant price bottoms, like the one that is forming right now.
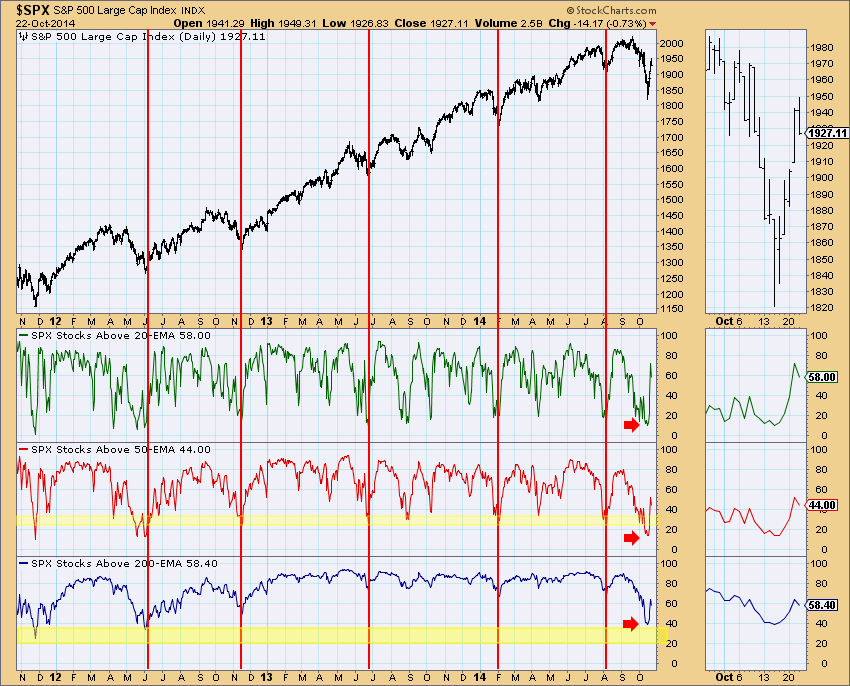
Concentrate on the bottom two windows, %Stocks Above Their 50-EMA and the %Stocks Above Their 200-EMA. These intermediate- to long-term indicators don't get very often. However, when they do bottom in oversold territory, it has correlated with a price bottom.
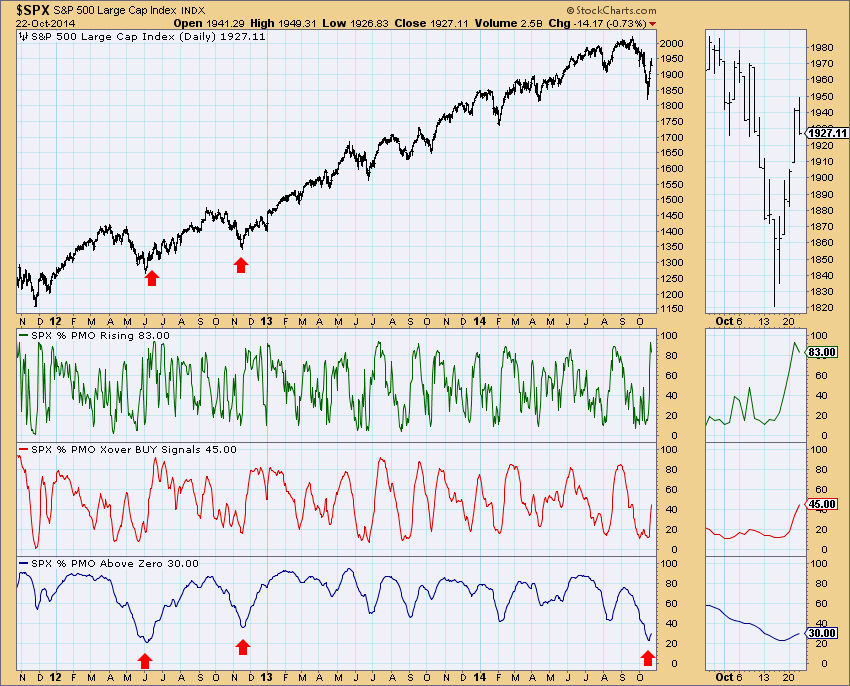
The PMO (Price Momentum Oscillator) Analysis chart below is similar to the one above. This indicator, as its name implies, measures momentum and oscillates above and below the zero line. The intermediate-term component on this chart is when the value is above zero which indicates positive internal strength. I've pointed out two major oversold bottoms that are in the same deeply oversold territory as this indicator reading is today, and they marked significant bottoms.
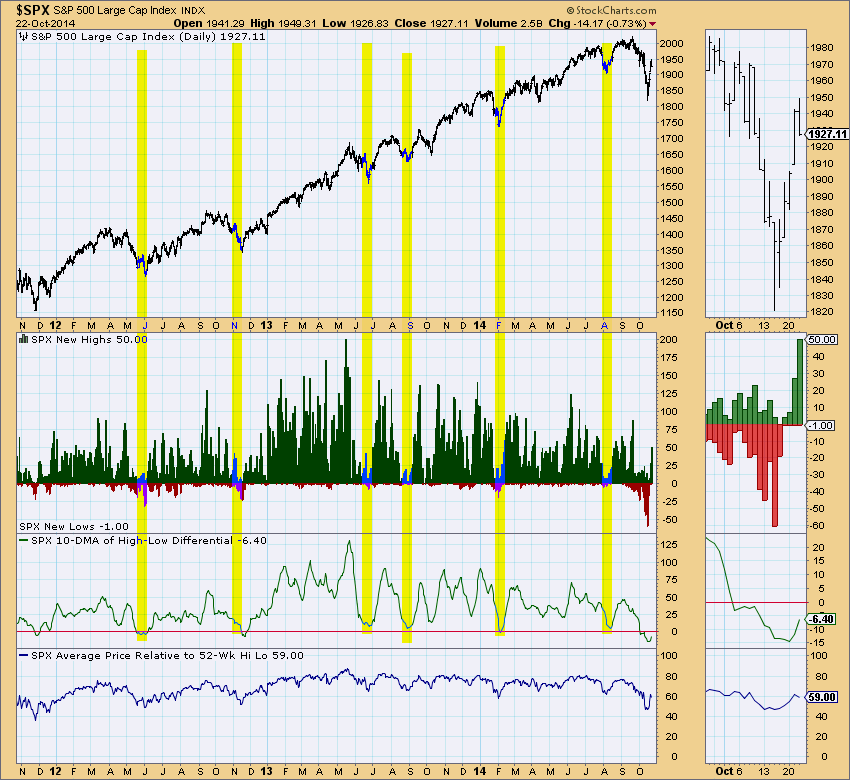
I've always been a fan of the 10-DMA of the High-Low Differential. It bottoms infrequently but the reversals tend to be very bullish.
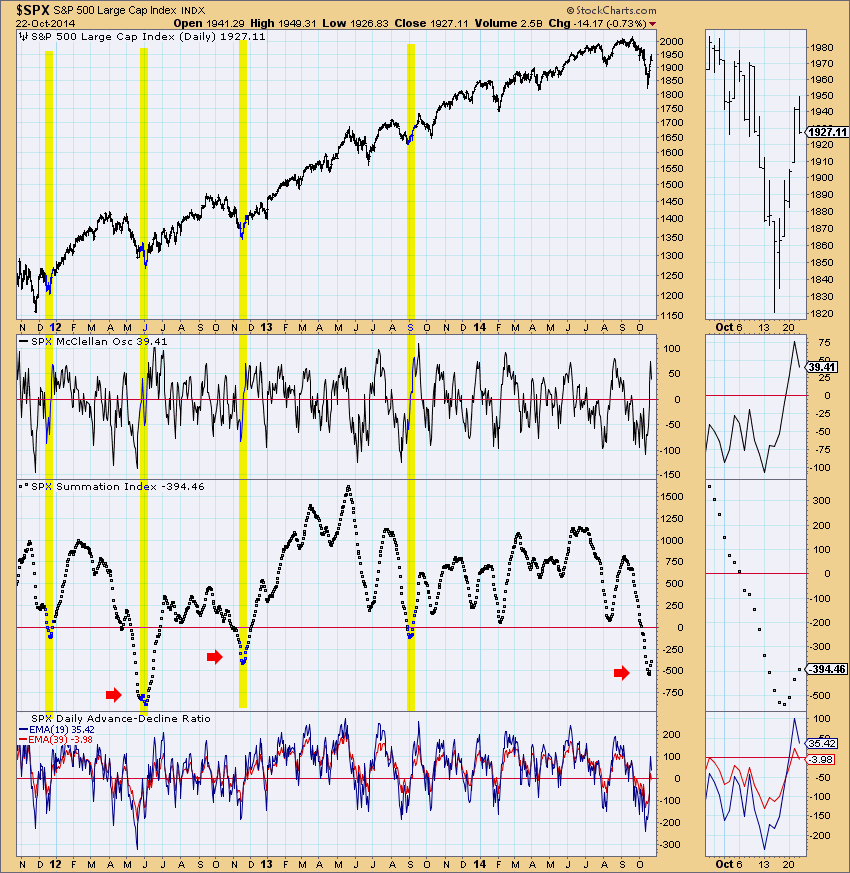
If you're not familiar with the McClellan Oscillator and Summation Index, I highly recommend you read the article about it in ChartSchool. The Summation Index is another intermediate-term indicator that has reached oversold territory. I've annotated the only four times it has fallen below zero and the arrows point to the only times it has gotten as oversold as it is now in three years.
Conclusion: Four indicator charts from the DecisionPoint Chart Gallery show intermediate-term indicators have reached the same deeply oversold levels as in prior years and they have bottomed which suggests the rally, at least in the intermediate term, will continue.
Happy Charting!
Erin
