 It was rightly brought to my attention that I haven't really explained what DecisionPoint Trend Model signals imply, especially the "Neutral" signal. First, remember that these "signals" are really "attention flags" to give you a heads up on a possible price reversal or quickly give you the market trend. They aren't meant to be used exclusively to make investment decisions.
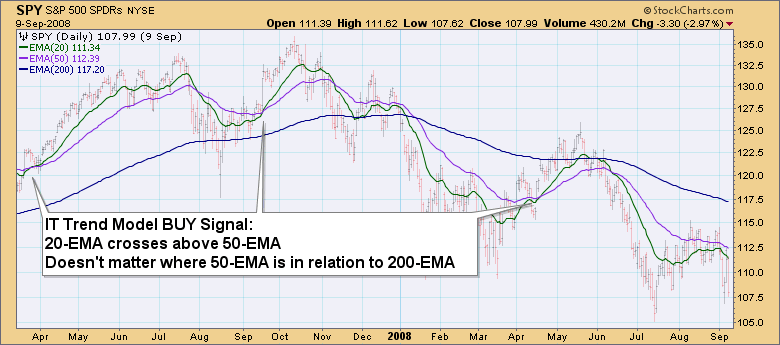
Intermediate-Term Trend Model BUY signals are just what they imply, they are a flag that price is now in a bull market and may be worth extra consideration as an investment opportunity. In our Intermediate-Term Trend Model, ANY time the 20-EMA crosses above the 50-EMA, that is a BUY signal.
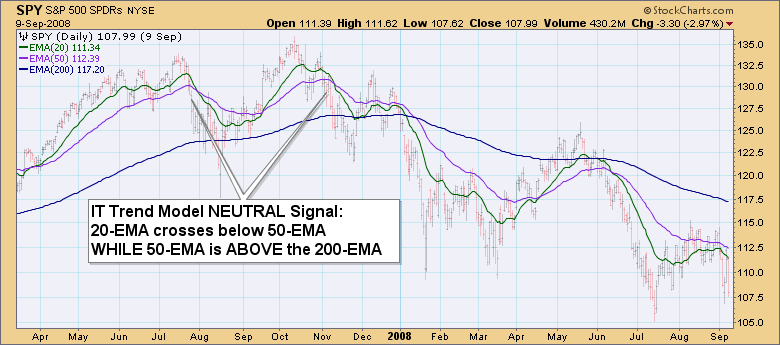
An Intermediate-Term Trend Model Neutral signal generates when the 20-EMA crosses below the 50-EMA WHILE the 50-EMA is above the 200-EMA. When the 50-EMA is above the 200-EMA, the Model considers the index, stock or ETF to be in a "bull market". When we turn in a Neutral signal to Timer Digest, they basically turn off our ability to earn "points" through a price increase or decrease. In simple terms, a Neutral signal means you are in cash or hedged.
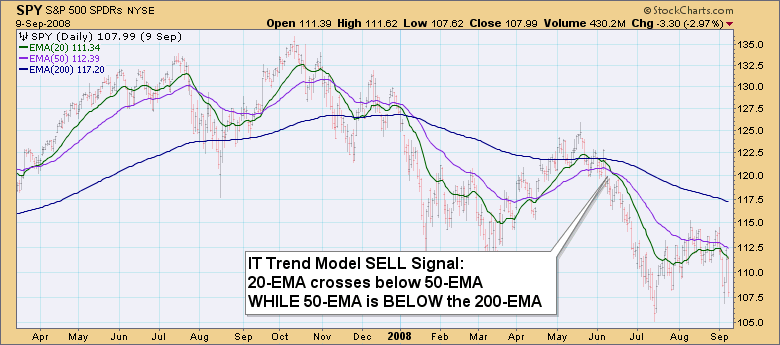
An Intermediate-Term Trend Model SELL signal is generated when the 20-EMA crosses below the 50-EMA WHILE the 50-EMA is below the 200-EMA. So if the 50-EMA is below the 200-EMA that implies a bear market is on, so a negative crossover tells us we should sell.
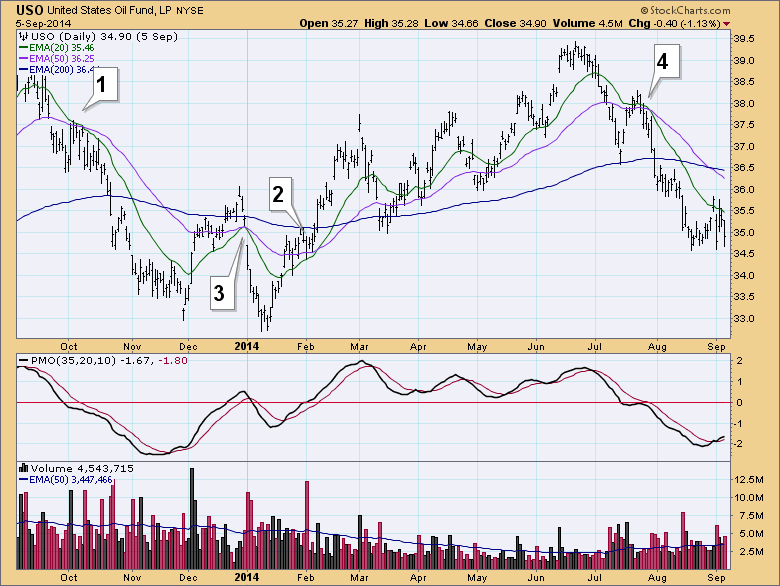
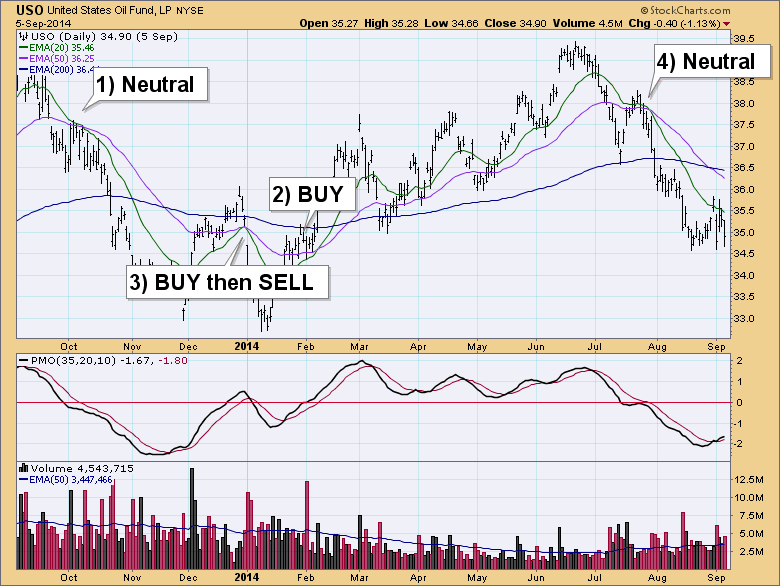
So have you learned something? Let's see! Here is a quick visual test for you to see if you can name what the Intermediate-Term Trend Model signals are. The answers are in the subsequent chart so don't scroll down too quickly!
IMPORTANT Caveat: You can use these signals however you wish to. For those traders that are less averse to risk, a Neutral signal could also be read as selling off instead of being hedged and a SELL signal could be viewed as going "short" instead of just as a selling off.
You'll find the corresponding answers in the chart below.
Happy Charting!
Erin
