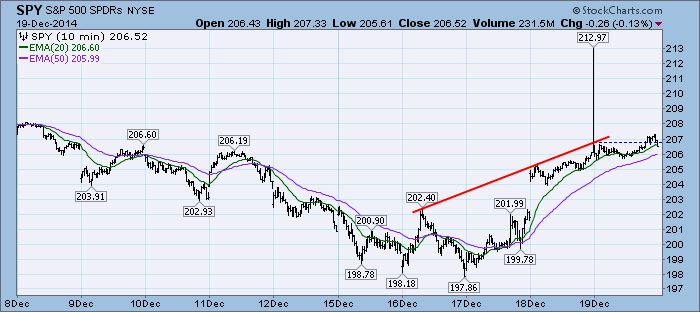
After two days of a strong rally, the market paused today, likely digesting the big move. Additionally, we usually see flat market action on options expiration days accompanied by high volume. The strange spike from the last 10 minutes yesterday held up so it wasn't a mistake.
The purpose of the DecisionPoint Daily Update is to quickly review the day's action, internal condition, and Trend Model status of the broad market (S&P 500), the nine SPDR Sectors, the U.S. Dollar, Gold, Crude Oil, and Bonds. To ensure that using this daily reference will be quick and painless, we are as brief as possible, and often we let a chart speak for itself.
SIGNALS: Here we include the current day's signal table, an excerpt from the DecisionPoint Alert Daily Report.
DECISIONPOINT ALERT DAILY REPORT
Friday, 12/19/2014

************************ DECISIONPOINT MARKET POSTURE ***********************

The following is the market posture suggested by our mechanical trend-
following tools. These are not trading recommendations, rather they are price
activity flags that should be qualified by chart analysis. The Trend Model is
used on all indexes.


                                     Days   Index     12/19   Points  Percent
Index               Posture     Date Elap  @Start     Close      P/L      P/L
------------------- ------- -------- ---- -------   -------  -------  -------
Stocks Medium-Term  Bullish 10/31/14   49   201.66   206.52    +4.86    +2.4%
Stocks Long-Term    Bullish 10/31/14   49   201.66   206.52    +4.86    +2.4%
Gold (NY Spot)      Bearish 08/21/14  120  1275.40  1196.00   +79.40    +6.2%
20+Yr T-Bond  (TLT) Bullish 01/17/14  336   102.65   125.87   +23.22   +22.6%
------------------- ------- -------- ---- -------   -------  -------  -------
Dollar Index  (UUP) Bullish 07/21/14  151    21.47    23.77    +2.30   +10.7%
Commodities   (GSG) Neutral 07/14/14  158    32.64    22.78     ....     ....
Crude Oil     (USO) Neutral 07/30/14  142    36.92    21.96     ....     ....
------------------- ------- -------- ---- -------   -------  -------  -------
S&P 500       (SPY)     BUY 10/31/14   49   201.66   206.52    +4.86    +2.4%
S&P Equal Wt  (RSP)     BUY 11/03/14   46    77.77    80.24    +2.47    +3.2%
Dow           (DIA)     BUY 10/31/14   49   172.64   177.65    +5.01    +2.9%
Nasdaq 100    (QQQ)     BUY 10/29/14   51    99.44   104.32    +4.88    +4.9%
NDX Equal Wt (QQEW)     BUY 10/30/14   50    40.66    43.17    +2.51    +6.2%
S&P 100       (OEF)     BUY 10/31/14   49    89.75    92.01    +2.26    +2.5%
S&P 400 MidCp (IJH)     BUY 11/05/14   44   141.76   145.15    +3.39    +2.4%
S&P 600 SmlCp (IJR)     BUY 11/03/14   46   111.40   112.69    +1.29    +1.2%
Total Market  (VTI)     BUY 11/03/14   46   104.08   106.91    +2.83    +2.7%
Consumer Disc (XLY)     BUY 11/05/14   44    67.27    70.87    +3.60    +5.4%
Cons Disc EWt (RCD)     BUY 11/03/14   46    82.86    87.14    +4.28    +5.2%
Consumer Stpl (XLP)     BUY 08/20/14  121    44.27    48.62    +4.35    +9.8%
Cons Stpl EWt (RHS)     BUY 10/21/14   59    98.15   105.24    +7.09    +7.2%
Energy        (XLE) Neutral 09/08/14  102    94.49    80.57     ....     ....
Energy EWt    (RYE) Neutral 09/08/14  102    87.04    69.76     ....     ....
Financial     (XLF)     BUY 10/29/14   51    23.32    24.68    +1.36    +5.8%
Financial EWt (RYF)     BUY 10/30/14   50    42.64    44.85    +2.21    +5.2%
Health Care   (XLV)     BUY 10/23/14   57    64.07    70.41    +6.34    +9.9%
Health Cr EWt (RYH)     BUY 05/09/14  224   115.95   145.49   +29.54   +25.5%
Industrial    (XLI)     BUY 10/30/14   50    54.37    56.59    +2.22    +4.1%
Industrl EWt  (RGI)     BUY 10/31/14   49    87.96    90.17    +2.21    +2.5%
Materials     (XLB) Neutral 12/15/14    4    46.26    48.82     ....     ....
Materials EWt (RTM) Neutral 12/16/14    3    80.53    84.49     ....     ....
Technology    (XLK)     BUY 10/31/14   49    40.33    41.57    +1.24    +3.1%
Technolgy EWt (RYT)     BUY 11/04/14   45    87.51    91.57    +4.06    +4.6%
Utilities     (XLU)     BUY 08/28/14  113    42.24    46.86    +4.62   +10.9%
Utilities EWt (RYU)     BUY 08/20/14  121    71.92    77.97    +6.05    +8.4%

Average                                64                               +5.9%
NOTE: Mechanical trading model signals define the implied bias of the price index based upon moving average relationships, but they do not necessarily call for a specific action. They are information flags that should prompt chart review. Further, they do not call for continuous buying or selling during the life of the signal. For example, a BUY signal will probably return the best results if action is taken soon after the signal is generated. Additional opportunities for buying may be found as price zigzags higher, but the trader must look for optimum entry points. Conversely, exit points to preserve gains (or minimize losses) may be evident before the model mechanically closes the signal.
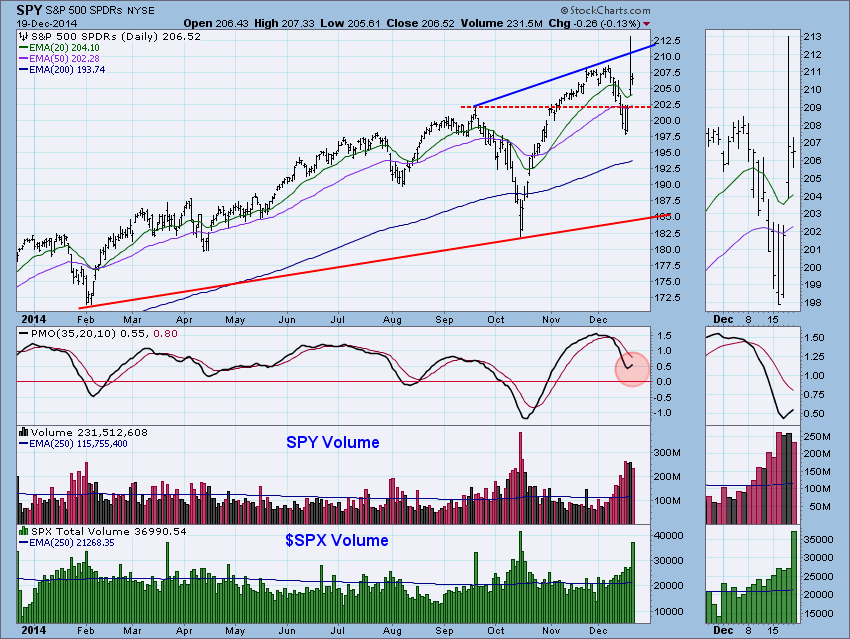
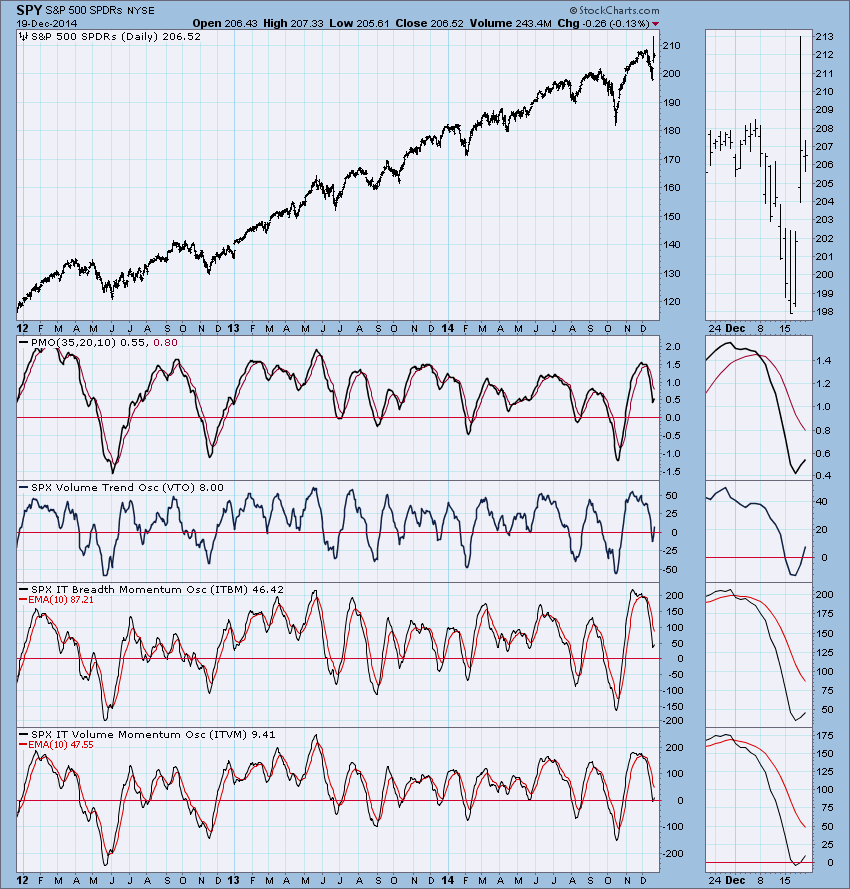
STOCKS: Based upon a 10/31/2014 Trend Model BUY signal, our current intermediate-term market posture for the S&P 500 (SPY) is bullish. The Trend Model, which informs our long-term outlook, is on a BUY signal as of 10/31/2014 so our long-term posture is bullish.
The Price Momentum Oscillator (PMO) is still rising and is nearing a positive crossover which will generate a PMO BUY signal. Volume was well above average due to option expiration.
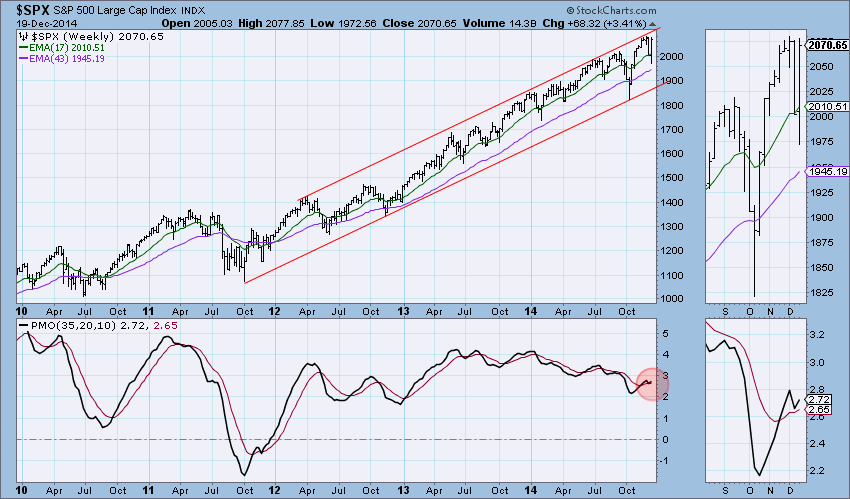
Price didn't reach overhead resistance in the rising trend channel on the weekly chart. The weekly PMO had turned down in response to the recent correction, but today it turned back up above its 10-EMA, barely escaping a negative crossover PMO SELL signal.
Ultra-Short-Term Indicators: We are still seeing climactic readings that could be read as an initiation impulse or exhaustion climax. Based on prior readings, I'm leaning toward this being an initiation. When these indicators move back to normal readings, we could see a market top.
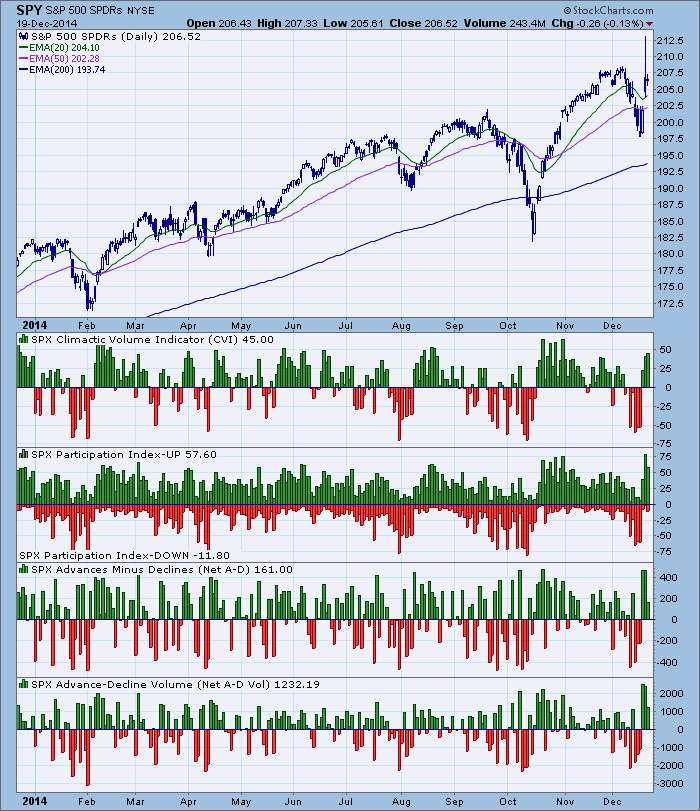
Short-Term Indicators: They have been rising and have reached neutral territory but they technically are in a declining trend. It would be especially bullish if readings break out from this trend.
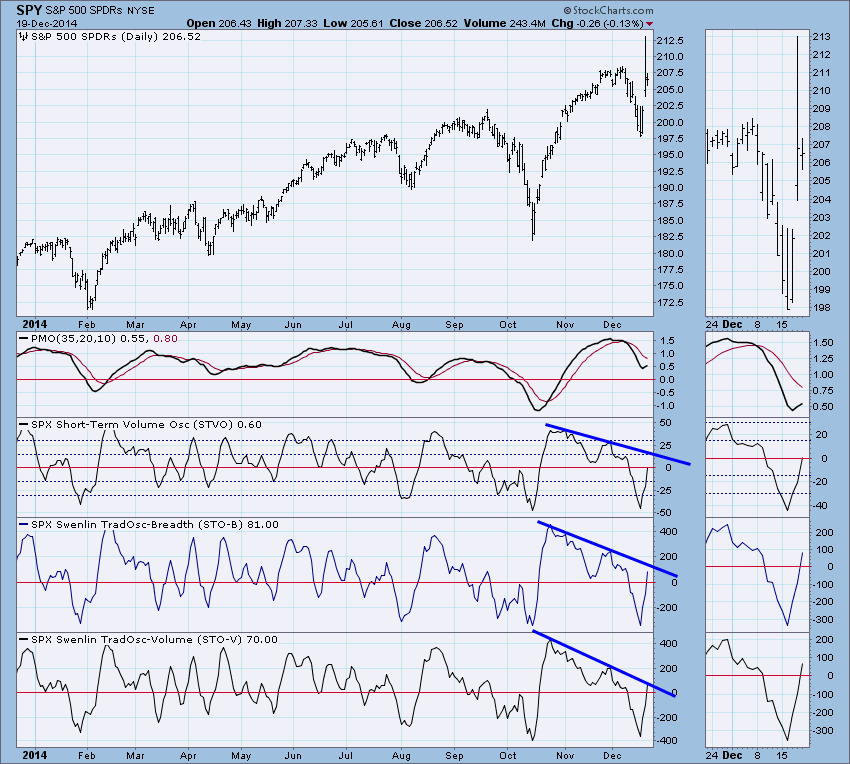
Intermediate-Term Indicators: It is now the second day of rising intermediate-term indicators. This is very bullish and definitely could be signally more upside movement.
Conclusion: Indicators are bullish and seem to infer that the rally will continue. Seasonally it makes sense that we'd see higher prices for a little while longer. A PMO positive crossover will be the confirmation that the rally has much higher to go.
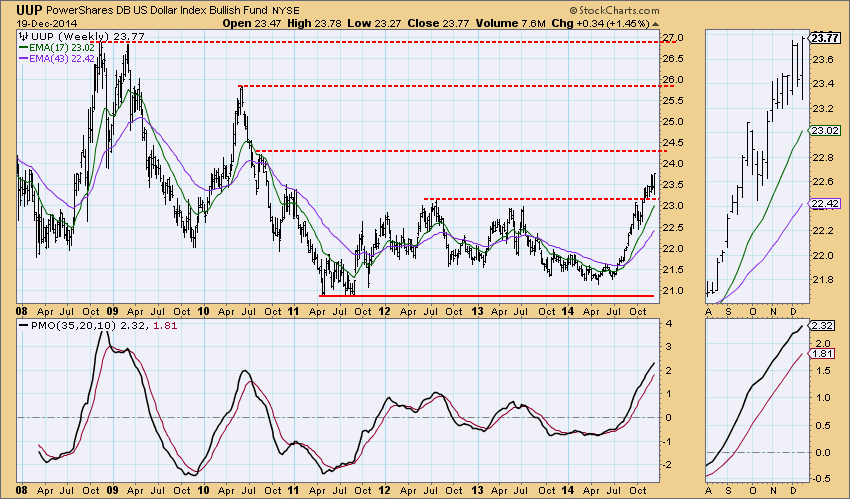
DOLLAR: As of 7/21/2014 the US Dollar Index ETF (UUP) is on a Trend Model BUY signal. The LT Trend Model, which informs our long-term outlook, is on a BUY signal as of 8/21/2014, so our long-term posture is bullish.
Since breaking above horizontal resistance at the 2012 high, price has been trapped between support at that high and the Summer 2010 high. The weekly PMO is rising strongly but is not too overbought when you compare it to readings 2008.
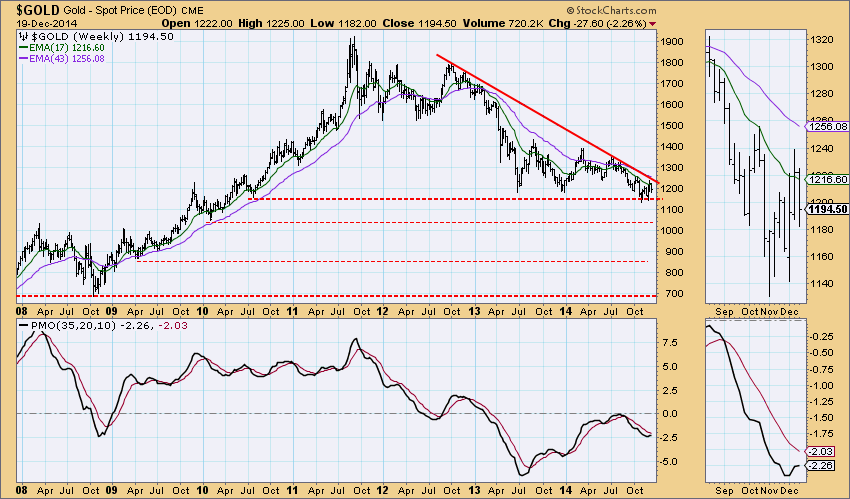
GOLD: As of 8/21/2014 Gold is on a Trend Model SELL signal. The LT Trend Model, which informs our long-term outlook, is on a SELL signal as of 2/15/2013, so our long-term posture is bearish.
There is a descending triangle formation on the weekly gold chart. Last week the PMO was rising but this week it seems to have fallen flat. Looking at the thumbnail, price has been in a rising trend since the November bottom. Unfortunately a descending triangle formation is bearish and as price narrows into the vertex of the triangle, expectation would be a break below horizontal resistance at the July low.
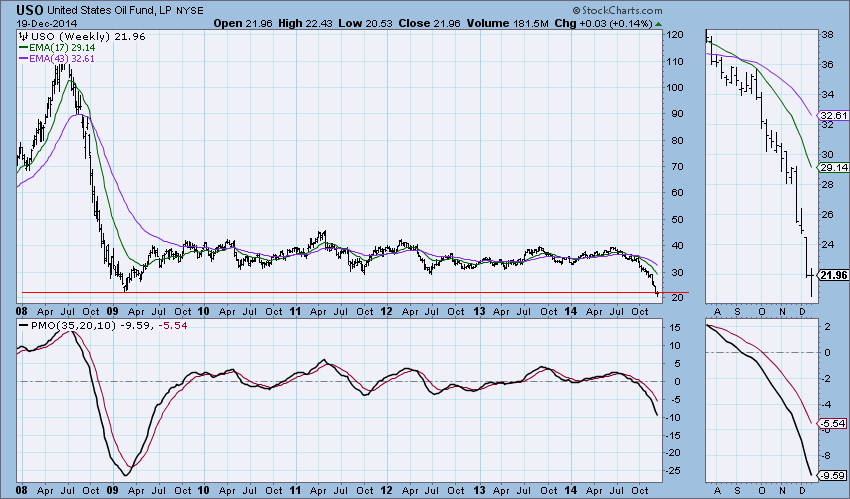
CRUDE OIL (USO): As of 7/30/2014 United States Oil Fund (USO) is on a Trend Model NEUTRAL signal. The LT Trend Model, which informs our long-term outlook, is on a SELL signal as of 8/28/2014, so our long-term posture is bearish.
This week critical support was broken at the 2009 low. The weekly PMO has been tumbling lower since the price top in 2014 and it hasn't really reached seriously oversold territory. Price may have lower to go.
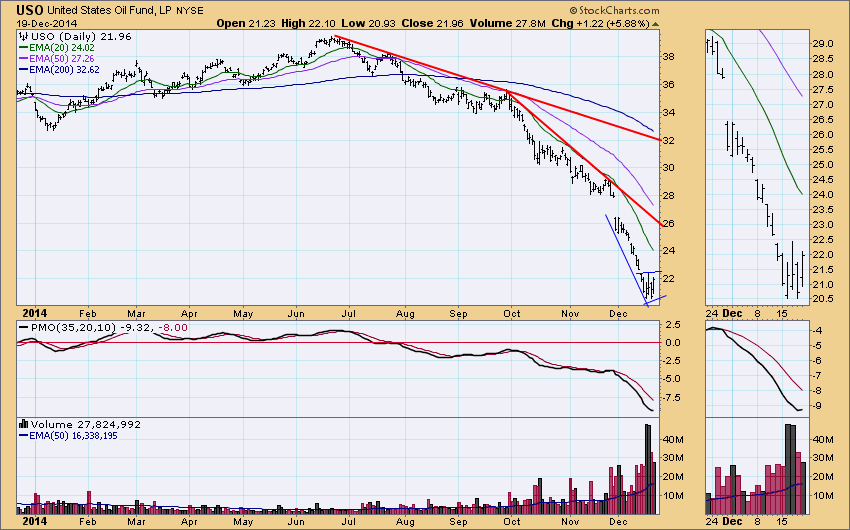
I noted a reverse flag formation on the daily chart yesterday which is very bearish. Should this flag execute with a break down below the flag, based on the length of the flagpole we could be looking at a minimum downside target of 14.00!
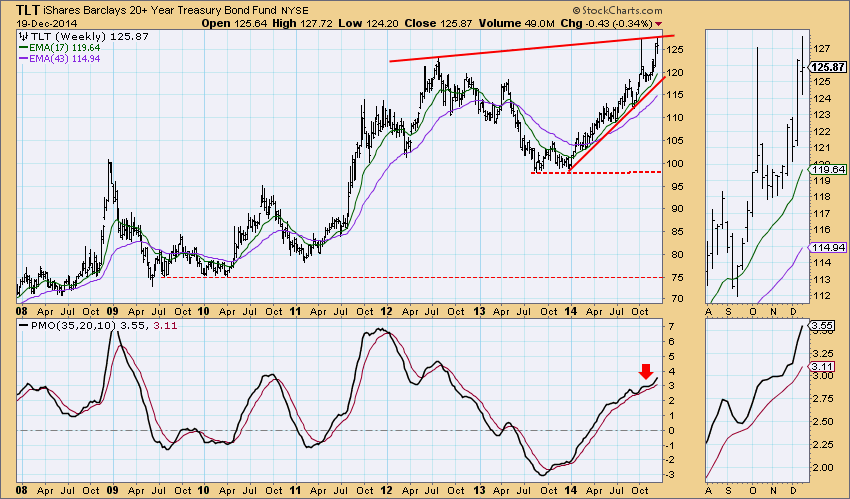
BONDS (TLT): As of 1/17/2014 The 20+ Year T-Bonds ETF (TLT) is on a Trend Model BUY signal. The LT Trend Model, which informs our long-term outlook, is on a BUY signal as of 3/24/2014, so our long-term posture is bullish.
TLT ran into resistance at the rising tops line drawn from the July high. The weekly PMO still looks bullish as it rises and manages to avoid a negative crossover. Momentum suggests that resistance will be broken.
Technical Analysis is a windsock, not a crystal ball.
Happy Charting!
- Erin
