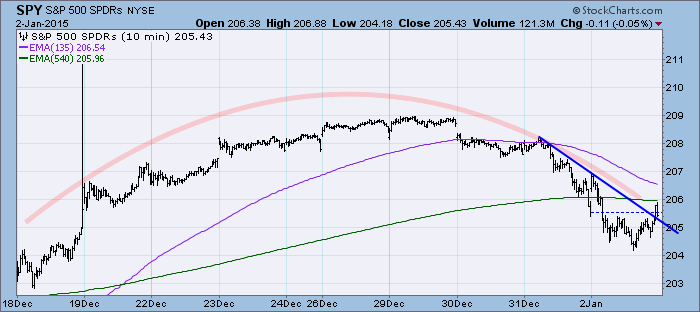
Despite the low volume of holiday trading, there was still a distinct price top that formed during the past two weeks. An ultra-short-term positive is that price broke out from overhead resistance that had formed starting Wednesday.
The purpose of the DecisionPoint Daily Update is to quickly review the day's action, internal condition, and Trend Model status of the broad market (S&P 500), the nine SPDR Sectors, the U.S. Dollar, Gold, Crude Oil, and Bonds. To ensure that using this daily reference will be quick and painless, we are as brief as possible, and often we let a chart speak for itself.
SIGNALS: Here we include the current day's signal table, an excerpt from the DecisionPoint Alert Daily Report.
DECISIONPOINT ALERT DAILY REPORT
Friday, 1/2/2015

************************ DECISIONPOINT MARKET POSTURE ***********************

The following is the market posture suggested by our mechanical trend-
following tools. These are not trading recommendations, rather they are price
activity flags that should be qualified by chart analysis. The Trend Model is
used on all indexes.


                                     Days   Index     01/02   Points  Percent
Index               Posture     Date Elap  @Start     Close      P/L      P/L
------------------- ------- -------- ---- -------   -------  -------  -------
Stocks Medium-Term  Bullish 10/31/14   63   200.55   205.43    +4.88    +2.4%
Stocks Long-Term    Bullish 10/31/14   63   200.55   205.43    +4.88    +2.4%
Gold (NY Spot)      Bearish 08/21/14  134  1275.40  1186.20   +89.20    +7.0%
20+Yr T-Bond  (TLT) Bullish 01/17/14  350   102.43   127.32   +24.89   +24.3%
------------------- ------- -------- ---- -------   -------  -------  -------
Dollar Index  (UUP) Bullish 07/21/14  165    21.47    24.20    +2.73   +12.7%
Commodities   (GSG) Neutral 07/14/14  172    32.64    21.22     ....     ....
Crude Oil     (USO) Neutral 07/30/14  156    36.92    19.89     ....     ....
------------------- ------- -------- ---- -------   -------  -------  -------
S&P 500       (SPY)     BUY 10/31/14   63   200.55   205.43    +4.88    +2.4%
S&P Equal Wt  (RSP)     BUY 11/03/14   60    77.77    80.03    +2.26    +2.9%
Dow           (DIA)     BUY 10/31/14   63   172.64   177.94    +5.30    +3.1%
Nasdaq 100    (QQQ)     BUY 10/29/14   65    99.44   102.94    +3.50    +3.5%
NDX Equal Wt (QQEW)     BUY 10/30/14   64    40.52    42.74    +2.22    +5.5%
S&P 100       (OEF)     BUY 10/31/14   63    88.84    90.82    +1.98    +2.2%
S&P 400 MidCp (IJH)     BUY 11/05/14   58   141.11   144.59    +3.48    +2.5%
S&P 600 SmlCp (IJR)     BUY 11/03/14   60   110.95   113.22    +2.27    +2.0%
Total Market  (VTI)     BUY 11/03/14   60   103.53   105.92    +2.39    +2.3%
Consumer Disc (XLY)     BUY 11/05/14   58    67.27    71.63    +4.36    +6.5%
Cons Disc EWt (RCD)     BUY 11/03/14   60    82.65    87.90    +5.25    +6.4%
Consumer Stpl (XLP)     BUY 08/20/14  135    44.27    48.35    +4.08    +9.2%
Cons Stpl EWt (RHS)     BUY 10/21/14   73    97.79   103.98    +6.19    +6.3%
Energy        (XLE) Neutral 09/08/14  116    94.49    79.53     ....     ....
Energy EWt    (RYE) Neutral 09/08/14  116    86.56    67.80     ....     ....
Financial     (XLF)     BUY 10/29/14   65    23.32    24.73    +1.41    +6.0%
Financial EWt (RYF)     BUY 10/30/14   64    42.45    44.80    +2.35    +5.5%
Health Care   (XLV)     BUY 10/23/14   71    64.07    68.63    +4.56    +7.1%
Health Cr EWt (RYH)     BUY 05/09/14  238   115.84   142.92   +27.08   +23.4%
Industrial    (XLI)     BUY 10/30/14   64    54.37    56.51    +2.14    +3.9%
Industrl EWt  (RGI)     BUY 10/31/14   63    87.54    90.31    +2.77    +3.2%
Materials     (XLB)     BUY 12/26/14    7    49.23    48.65    -0.58    -1.2%
Materials EWt (RTM)     BUY 12/22/14   11    83.94    83.88    -0.06    -0.1%
Technology    (XLK)     BUY 10/31/14   63    40.33    41.27    +0.94    +2.3%
Technolgy EWt (RYT)     BUY 11/04/14   59    87.04    90.76    +3.72    +4.3%
Utilities     (XLU)     BUY 08/28/14  127    42.24    47.44    +5.20   +12.3%
Utilities EWt (RYU)     BUY 08/20/14  135    71.41    79.09    +7.68   +10.8%

Average                                77                               +5.3%
NOTE: Mechanical trading model signals define the implied bias of the price index based upon moving average relationships, but they do not necessarily call for a specific action. They are information flags that should prompt chart review. Further, they do not call for continuous buying or selling during the life of the signal. For example, a BUY signal will probably return the best results if action is taken soon after the signal is generated. Additional opportunities for buying may be found as price zigzags higher, but the trader must look for optimum entry points. Conversely, exit points to preserve gains (or minimize losses) may be evident before the model mechanically closes the signal.
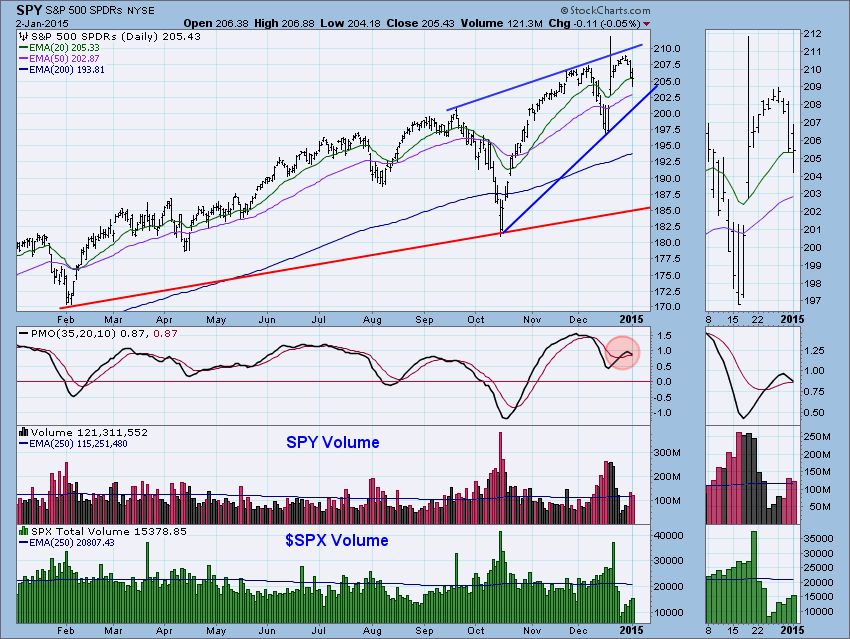
STOCKS: Based upon a 10/31/2014 Trend Model BUY signal, our current intermediate-term market posture for the S&P 500 (SPY) is bullish. The Trend Model, which informs our long-term outlook, is on a BUY signal as of 10/31/2014 so our long-term posture is bullish.
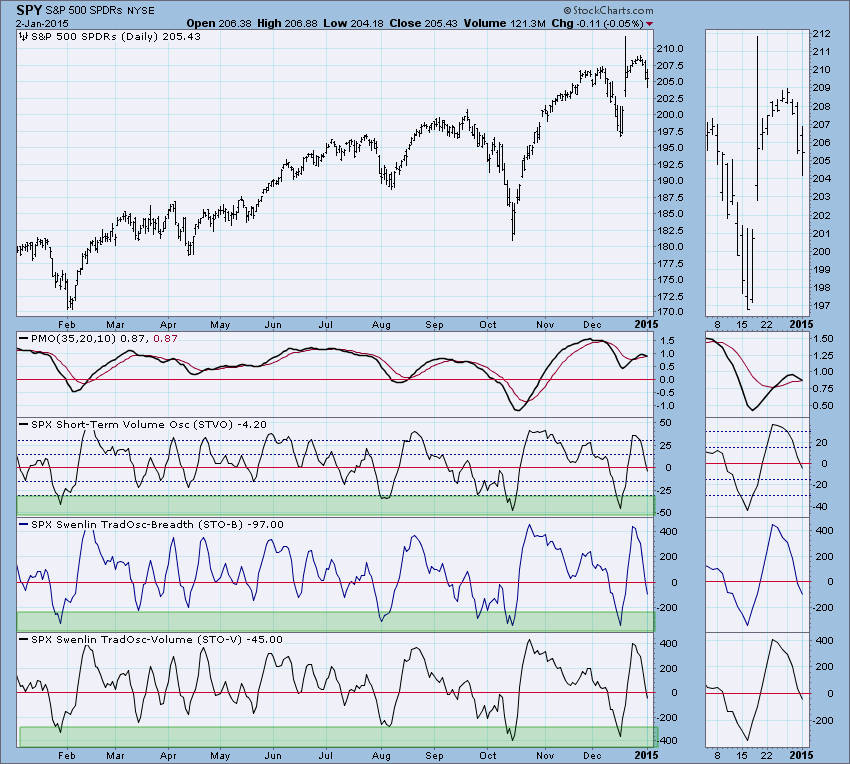
Price has pulled back since hitting overhead resistance. Based on the nearing PMO SELL signal and bearish ascending wedge, I suspect this will become more of a correction than pullback. Volume on the $SPX has been slowly rising during the recent price decline which is also bearish.
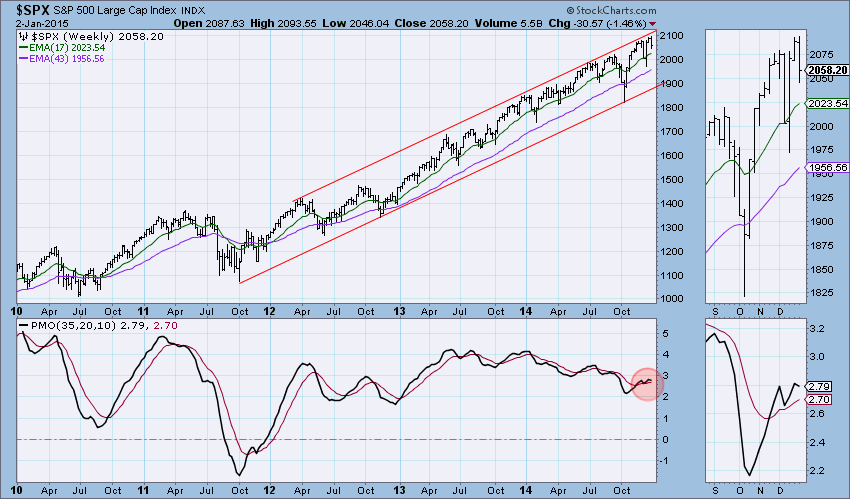
Looking at the weekly chart, price is rising up against overhead resistance. Should price top and pull back from resistance, the first line of support would be at last month's low. If that doesn't hold, long-term support is around 1920 at the bottom of the rising price channel.
Ultra-Short-Term Indicators: Negative readings are elevated, but have backed down from Wednesday's readings. This could indicate a selling is getting exhausted in the very near-term.
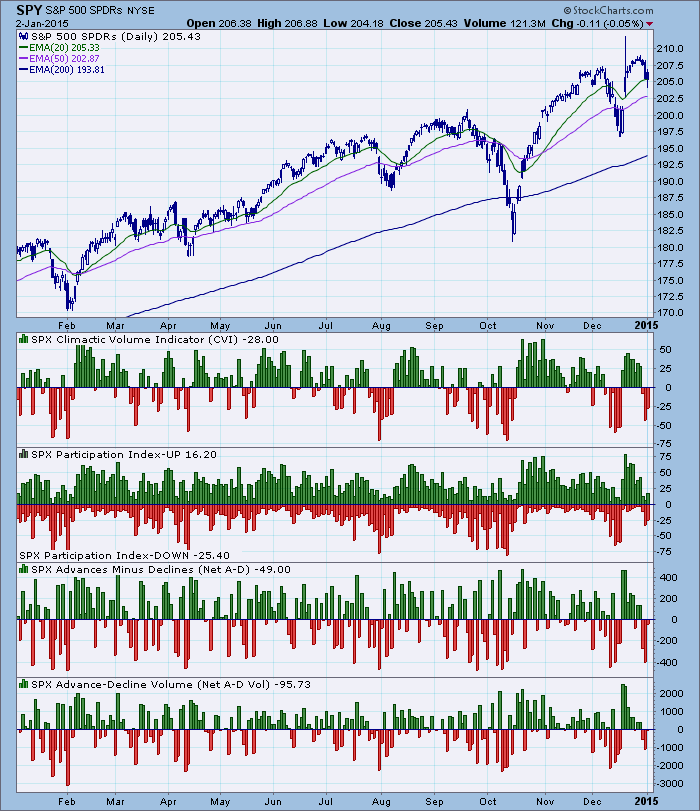
Short-Term Indicators: Readings are neutral across the board and declining. There is real estate to cover before they get oversold so these indicators are still bearish.
Intermediate-Term Indicators: The ITVM followed the ITBM with a negative crossover its EMA. This is highly bearish in the intermediate term.
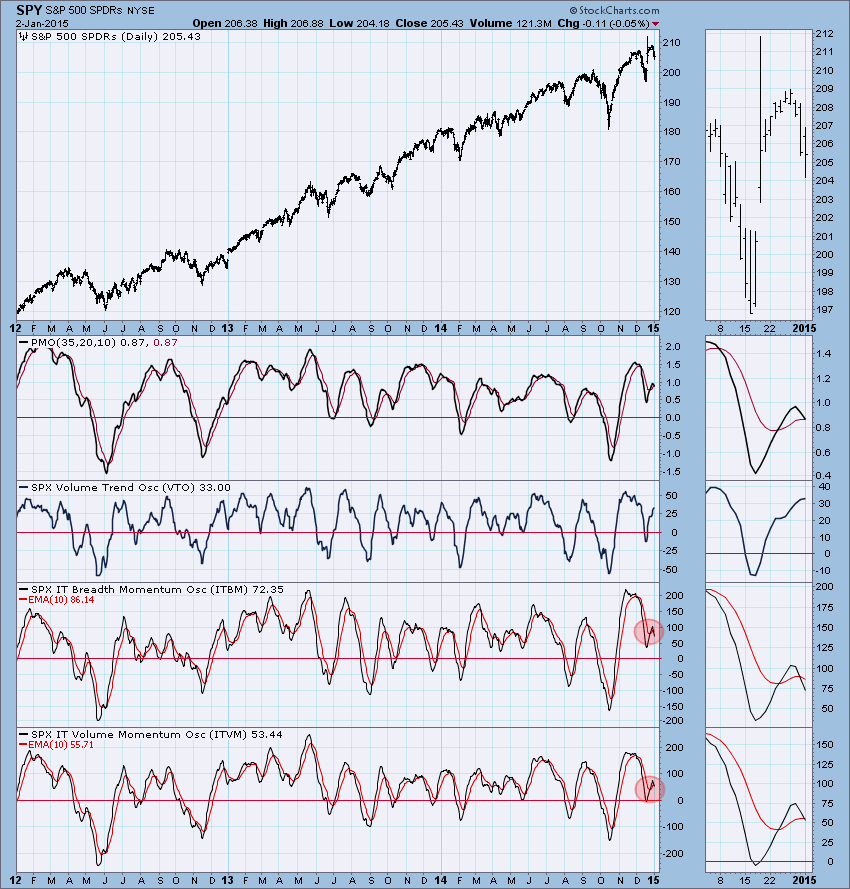
Conclusion: Indicators are bearish but ultra-short and short-term indicators are hinting at a small selling exhaustion being reached soon. However, intermediate-term indicators are very bearish, telling us that the big picture is negative.
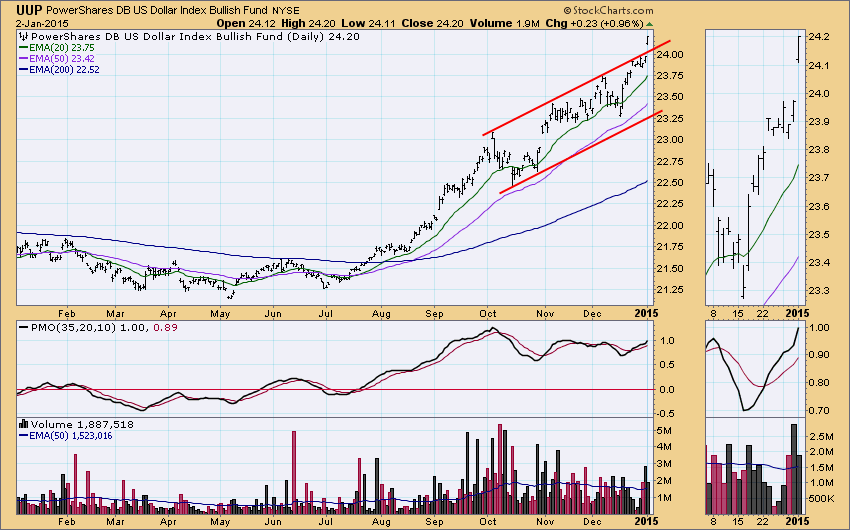
DOLLAR: As of 7/21/2014 the US Dollar Index ETF (UUP) is on a Trend Model BUY signal. The LT Trend Model, which informs our long-term outlook, is on a BUY signal as of 8/21/2014, so our long-term posture is bullish.
The dollar had an impressive breakout above the rising trend it has been in. The PMO is now rising sharply. The negative is that the PMO is overbought.
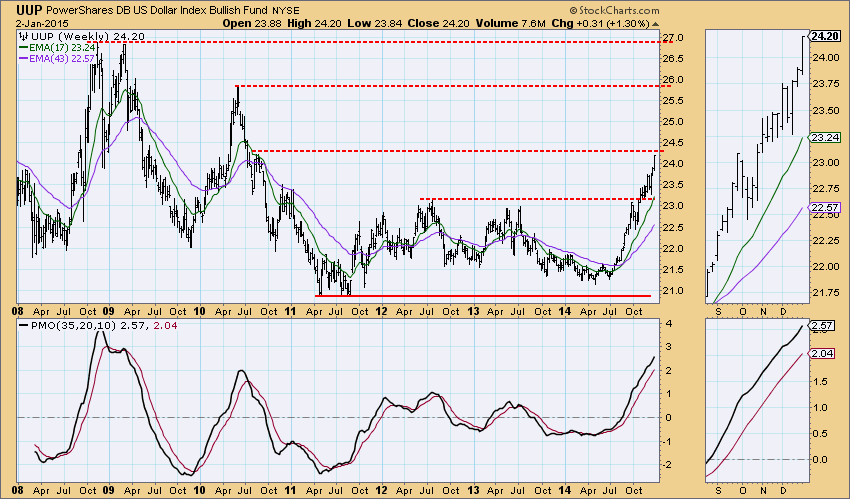
The weekly picture is somewhat troubling. Price has now reached long-term resistance, albeit not major resistance as we see with the 2010 high and 2009 high. The weekly PMO has time and distance to cover before getting too overbought so a move through this intermediate resistance line is likely.
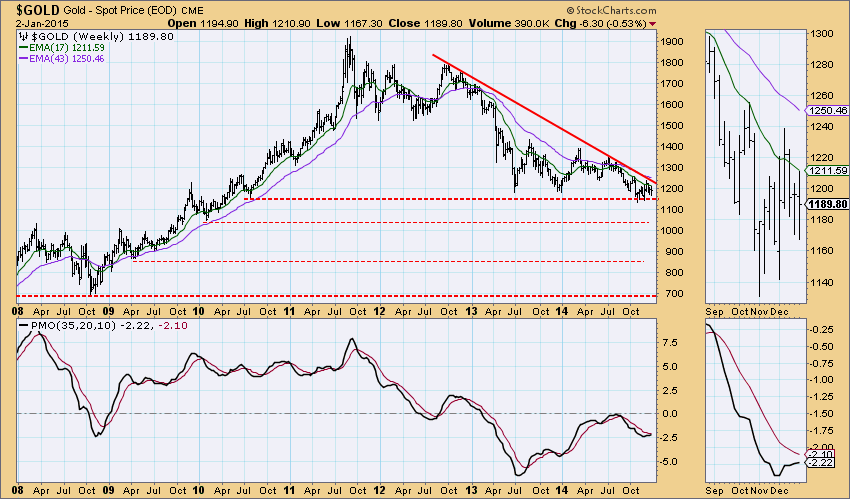
GOLD: As of 8/21/2014 Gold is on a Trend Model SELL signal. The LT Trend Model, which informs our long-term outlook, is on a SELL signal as of 2/15/2013, so our long-term posture is bearish.
Price is getting further trapped by declining tops line resistance and horizontal support near the 2010 third quarter bottom and the 2013 bottoms. The weekly PMO is rising but is losing speed as it gets closer to its EMA. It would be very negative should the weekly PMO top below its EMA which is already below zero.
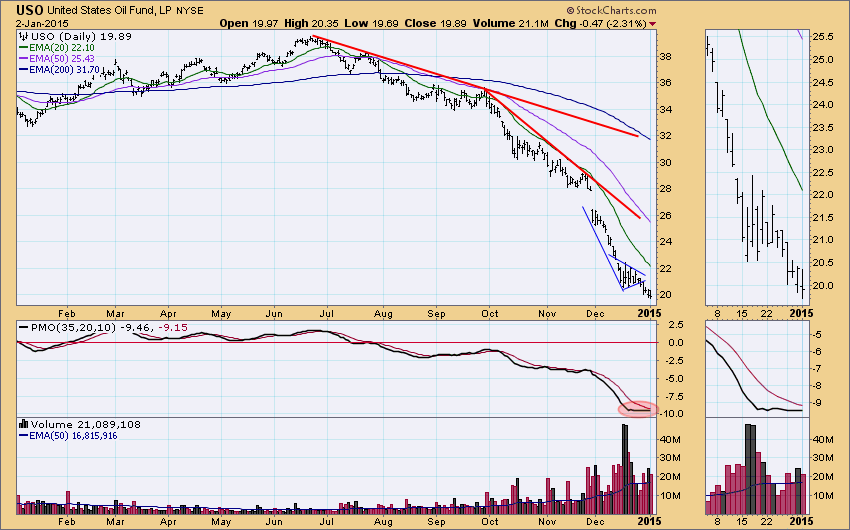
CRUDE OIL (USO): As of 7/30/2014 United States Oil Fund (USO) is on a Trend Model NEUTRAL signal. The LT Trend Model, which informs our long-term outlook, is on a SELL signal as of 8/28/2014, so our long-term posture is bearish.
Price has been reluctantly declining since breaking down from the reverse flag formation. As noted in last week's Update a minimum downside target of 14.00 was calculated after the bear flag executed.
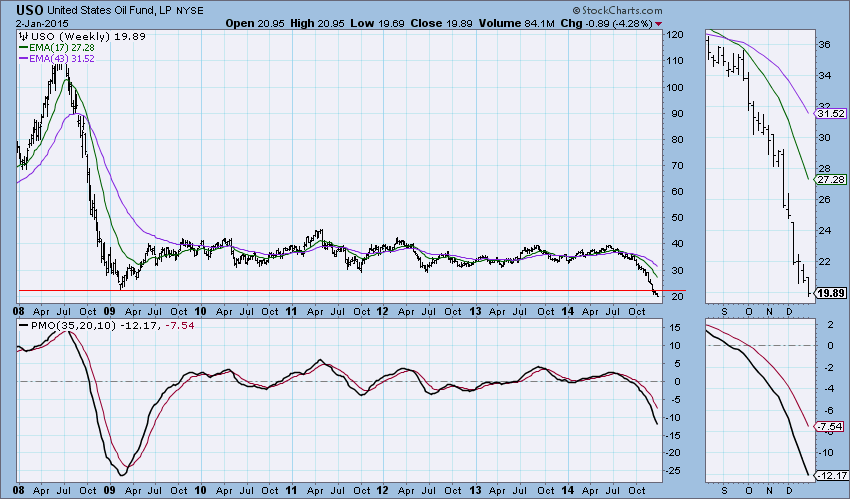
The weekly chart looks no better than the daily. All-time lows continue to be hit as price broke below the very long-term resistance at the all-time low in 2009. The big concern is that the weekly PMO has broken below previous lows around -5 and is now headed to test the extremely overbought readings around -25.
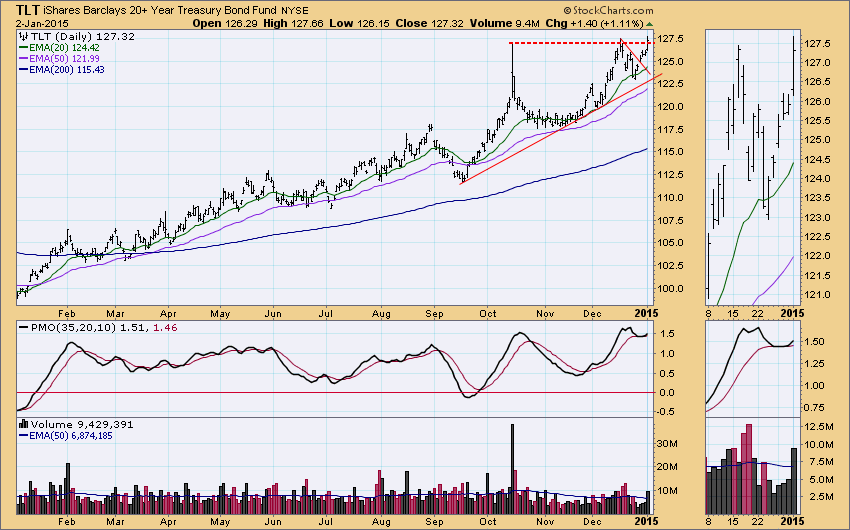
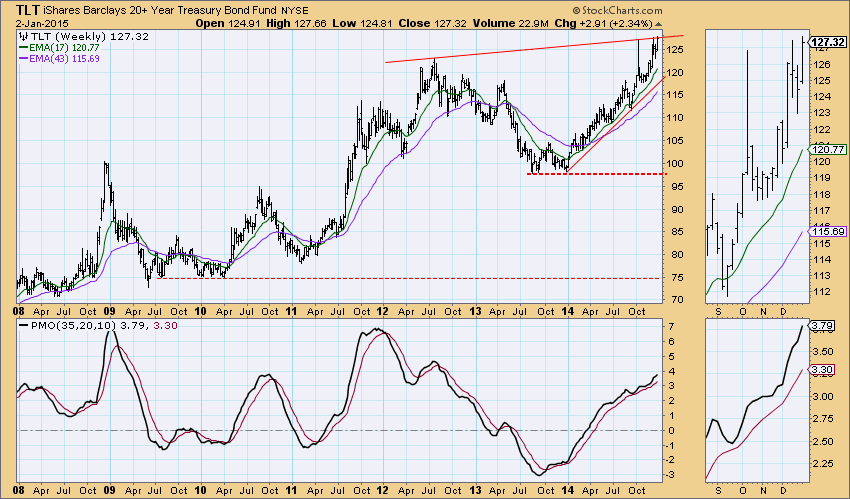
BONDS (TLT): As of 1/17/2014 The 20+ Year T-Bonds ETF (TLT) is on a Trend Model BUY signal. The LT Trend Model, which informs our long-term outlook, is on a BUY signal as of 3/24/2014, so our long-term posture is bullish.
The intraday highs from last month and November were broken today, although an all-time closing high was not hit. The PMO is rising since kissing its EMA but it is in very overbought territory which is troubling.
The weekly chart shows that overhead resistance is mostly holding. However the weekly PMO continues to rise. It has avoided many opportunities to switch to a PMO SELL signal and it isn't overbought yet.
Technical Analysis is a windsock, not a crystal ball.
Happy Charting!
- Erin
