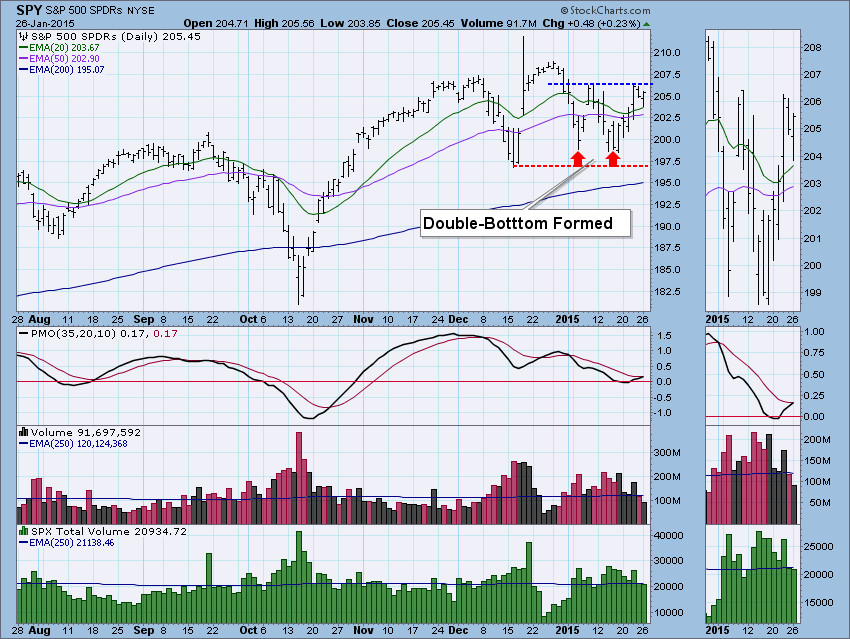
I've been watching our indicator charts very closely for quite sometime now as we prepare for a possible breakout from the double-bottom formation on the SPY. Additionally, we had a Trend Model signal change on our DP Alert Daily Report (found in the subscriber-only DP Reports Blog).
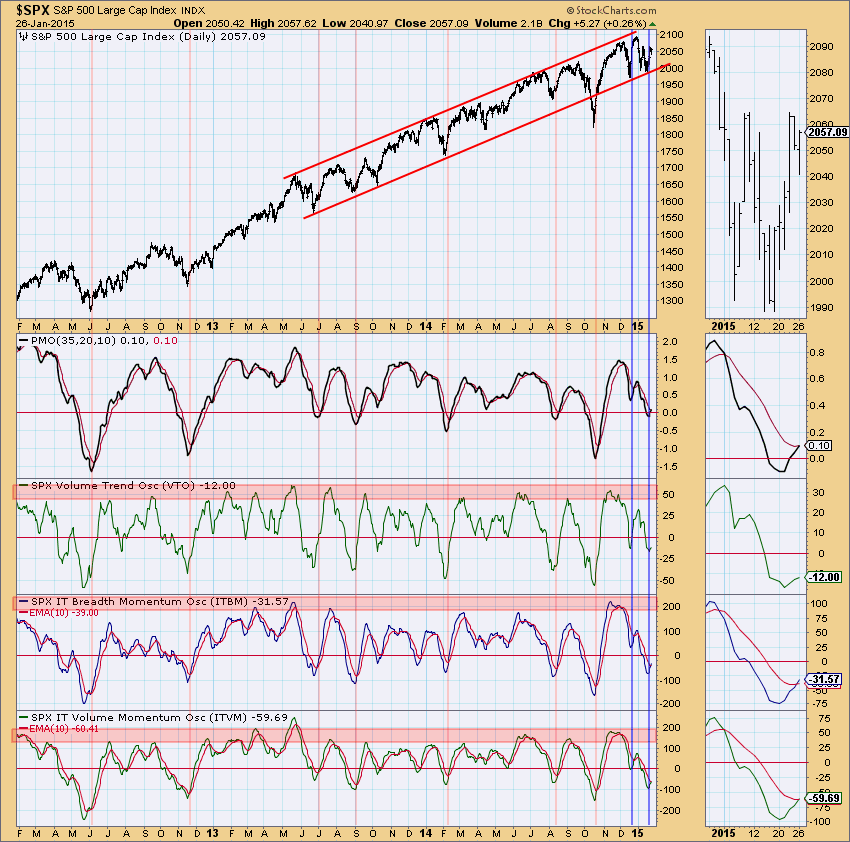
Intermediate-Term indicators, the ITBM and ITVM have had positive crossovers their EMAs which is very bullish for the intermediate term. Notice how bottoms on these indicators tend to come right at most price bottoms. This particular bottom is better than the previous, mainly because it is coming out of neutral territory. However, we do see that these indicators can move much lower. This chart is found in the DP Chart Gallery. I've annotated it for you.
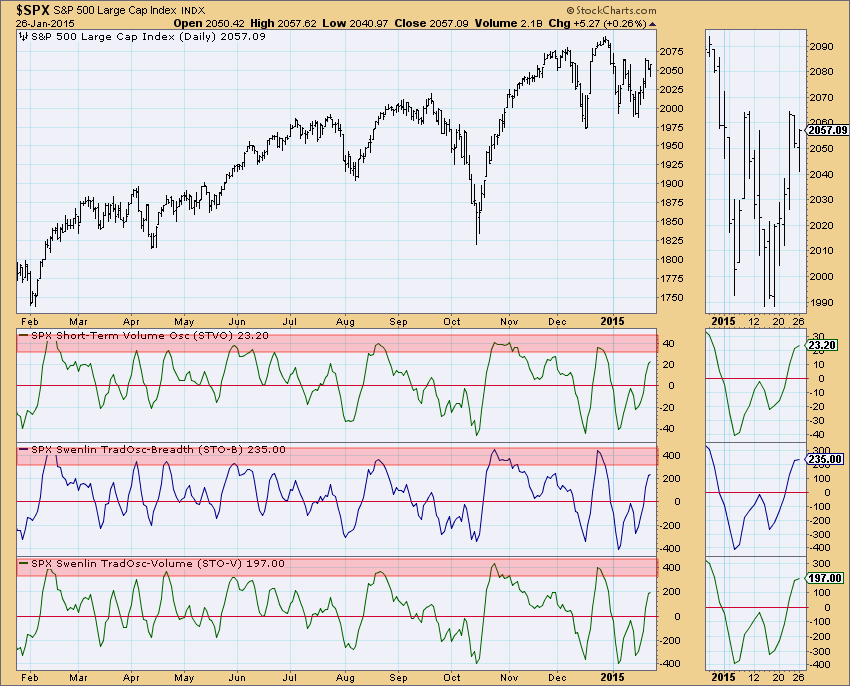
Short-term indicators are still bullish as they continue rising, avoiding overbought territory so far. They slowed down somewhat today, but they continue to rise. I don't like that they are getting overbought.
While both short-term and intermediate-term indicators are bullish, I'm not liking that price was turned back at the double-bottom neckline. That neckline is a continuation of an area of resistance that began with the November and early December tops which could explain the hesitation. Volume has been 'meh' the past few days which also isn't great. However, the Price Momentum Oscillator (PMO) is about to crossover its EMA which would generate a PMO BUY signal on the SPY. Current market trend and conditions tell us to expect to see the bullish double-bottom pattern execute.
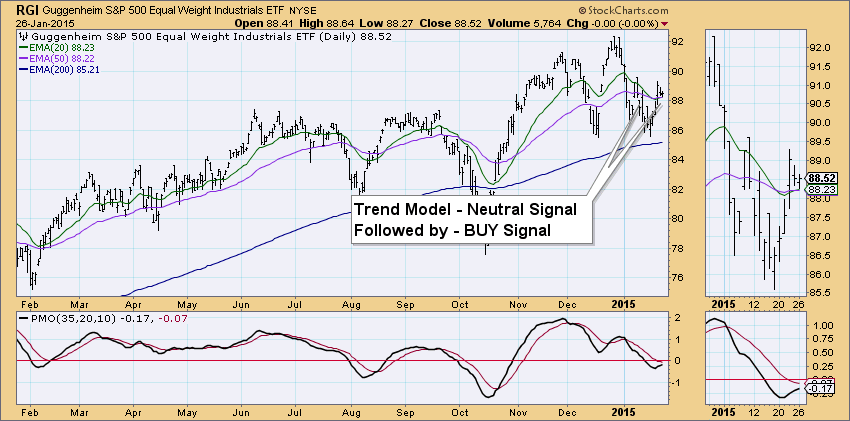
Today, the Industrial equal-weighted ETF (RGI) generated an intermediate-term Trend Model BUY signal. An excerpt of the report is below:
DECISIONPOINT ALERT DAILY REPORT
Monday, 1/26/2015

************************ DECISIONPOINT MARKET POSTURE ***********************

The following is the market posture suggested by our mechanical trend-
following tools. These are not trading recommendations, rather they are price
activity flags that should be qualified by chart analysis. The Trend Model is
used on all indexes.

                                     Days   Index     01/26   Points  Percent
Index               Posture     Date Elap  @Start     Close      P/L      P/L
------------------- ------- -------- ---- -------   -------  -------  -------
Industrl EWt  (RGI)     BUY 01/26/15    0    88.52    88.52 * Changed Today * <-----
Materials     (XLB) Neutral 01/06/15   20    46.99    48.46     ....     ....
Materials EWt (RTM)     BUY 01/23/15    3    83.59    83.83    +0.24    +0.3%
Technology    (XLK)     BUY 10/31/14   87    40.33    41.28    +0.95    +2.4%
Technolgy EWt (RYT)     BUY 11/04/14   83    87.04    89.68    +2.64    +3.0%
Utilities     (XLU)     BUY 08/28/14  151    42.24    49.11    +6.87   +16.3%
Utilities EWt (RYU)     BUY 08/20/14  159    71.41    81.26    +9.85   +13.8%
This comes only days after a Neutral signal appeared. The Neutral signal generated when the 20-EMA crossed below the 50-EMA while the 50-EMA was above the 200-EMA. Had the 50-EMA been below the 200-EMA it would have implied RGI was in a long-term bear market so a SELL signal rather than a Neutral would have been generated. Any time the 20-EMA crosses above the 50-EMA it is a Trend Model BUY signal. I believe this BUY signal may be credible since the PMO is nearing a positive crossover its EMA. Also if you look at the thumbnail, you could possibly make a case for a bull flag forming.
If you haven't already, I invite you to sign up for my first DecisionPoint LIVE! webinar this Wednesday at 4:30pm Eastern. I'll be walking you through the free DecisionPoint Chart Gallery and reading the charts for you. I'll cover our Big Four: Dollar, Gold, Oil and Bonds as well. To register, click here.
Happy Charting!
Erin
