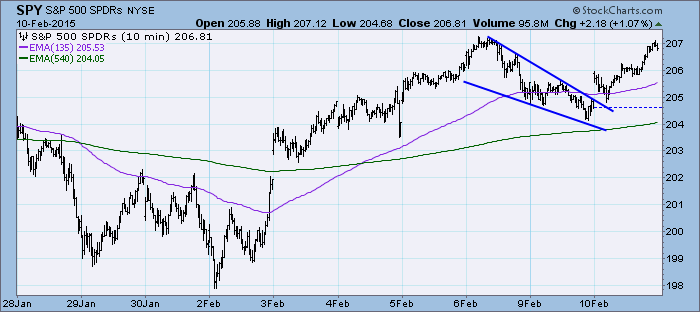
Today saw a breakout from the bullish descending wedge pattern that had formed over the past two trading days. In the last 20 minutes of the trading day, price hit overhead resistance at the 2/6 high and was turned back.
** Don't forget to sign up for tomorrow's DecisionPoint LIVE! webinar. I'll be demonstrating how you can use Tracker reports to find investment opportunities, as well as giving you the latest market overview. Sign up here! **
The purpose of the DecisionPoint Daily Update is to quickly review the day's action, internal condition, and Trend Model status of the broad market (S&P 500), the nine SPDR Sectors, the U.S. Dollar, Gold, Crude Oil, and Bonds. To ensure that using this daily reference will be quick and painless, we are as brief as possible, and often we let a chart speak for itself.
SIGNALS: Here we include the current day's signal table, an excerpt from the DecisionPoint Alert Daily Report.
DECISIONPOINT ALERT DAILY REPORT
Tuesday, 2/10/2015

************************ DECISIONPOINT MARKET POSTURE ***********************

The following is the market posture suggested by our mechanical trend-
following tools. These are not trading recommendations, rather they are price
activity flags that should be qualified by chart analysis. The Trend Model is
used on all indexes.


                                     Days   Index     02/10   Points  Percent
Index               Posture     Date Elap  @Start     Close      P/L      P/L
------------------- ------- -------- ---- -------   -------  -------  -------
Stocks Medium-Term  Bullish 10/31/14  102   200.55   206.81    +6.26    +3.1%
Stocks Long-Term    Bullish 10/31/14  102   200.55   206.81    +6.26    +3.1%
Gold (NY Spot)      Bullish 01/12/15   29  1233.40  1232.20    -1.20    -0.1%
20+Yr T-Bond  (TLT) Bullish 01/17/14  389   102.22   129.71   +27.49   +26.9%
------------------- ------- -------- ---- -------   -------  -------  -------
Dollar Index  (UUP) Bullish 07/21/14  204    21.47    25.07    +3.60   +16.8%
Commodities   (GSG) Neutral 07/14/14  211    32.64    20.58     ....     ....
Crude Oil     (USO) Neutral 07/30/14  195    36.92    18.94     ....     ....
------------------- ------- -------- ---- -------   -------  -------  -------
S&P 500       (SPY)     BUY 10/31/14  102   200.55   206.81    +6.26    +3.1%
S&P Equal Wt  (RSP)     BUY 11/03/14   99    77.77    80.81    +3.04    +3.9%
Dow           (DIA)     BUY 02/03/15    7   176.33   178.51    +2.18    +1.2%
Nasdaq 100    (QQQ)     BUY 10/29/14  104    99.44   104.40    +4.96    +5.0%
NDX Equal Wt (QQEW)     BUY 10/30/14  103    40.52    42.95    +2.43    +6.0%
S&P 100       (OEF)     BUY 02/04/15    6    89.96    91.23    +1.27    +1.4%
S&P 400 MidCp (IJH)     BUY 11/05/14   97   141.11   147.81    +6.70    +4.7%
S&P 600 SmlCp (IJR)     BUY 11/03/14   99   110.95   113.94    +2.99    +2.7%
Total Market  (VTI)     BUY 11/03/14   99   103.53   106.88    +3.35    +3.2%
Consumer Disc (XLY)     BUY 11/05/14   97    67.27    73.55    +6.28    +9.3%
Cons Disc EWt (RCD)     BUY 11/03/14   99    82.65    89.33    +6.68    +8.1%
Consumer Stpl (XLP)     BUY 08/20/14  174    44.27    49.27    +5.00   +11.3%
Cons Stpl EWt (RHS)     BUY 10/21/14  112    97.79   107.22    +9.43    +9.6%
Energy        (XLE) Neutral 09/08/14  155    94.49    79.86     ....     ....
Energy EWt    (RYE) Neutral 09/08/14  155    86.56    68.64     ....     ....
Financial     (XLF) Neutral 01/20/15   21    23.39    24.21     ....     ....
Financial EWt (RYF)     BUY 02/05/15    5    44.36    44.60    +0.24    +0.5%
Health Care   (XLV)     BUY 10/23/14  110    64.07    70.12    +6.05    +9.4%
Health Cr EWt (RYH)     BUY 05/09/14  277   115.84   146.64   +30.80   +26.6%
Industrial    (XLI)     BUY 10/30/14  103    54.37    56.36    +1.99    +3.7%
Industrl EWt  (RGI)     BUY 02/09/15    1    88.82    89.39    +0.57    +0.6%
Materials     (XLB)     BUY 02/05/15    5    50.04    50.23    +0.19    +0.4%
Materials EWt (RTM)     BUY 02/03/15    7    85.23    87.65    +2.42    +2.8%
Technology    (XLK)     BUY 02/09/15    1    41.04    41.65    +0.61    +1.5%
Technolgy EWt (RYT)     BUY 02/05/15    5    89.61    90.58    +0.97    +1.1%
Utilities     (XLU)     BUY 08/28/14  166    42.24    47.10    +4.86   +11.5%
Utilities EWt (RYU)     BUY 08/20/14  174    71.41    79.66    +8.25   +11.6%

Average                                88                               +5.8%
NOTE: Mechanical trading model signals define the implied bias of the price index based upon moving average relationships, but they do not necessarily call for a specific action. They are information flags that should prompt chart review. Further, they do not call for continuous buying or selling during the life of the signal. For example, a BUY signal will probably return the best results if action is taken soon after the signal is generated. Additional opportunities for buying may be found as price zigzags higher, but the trader must look for optimum entry points. Conversely, exit points to preserve gains (or minimize losses) may be evident before the model mechanically closes the signal.
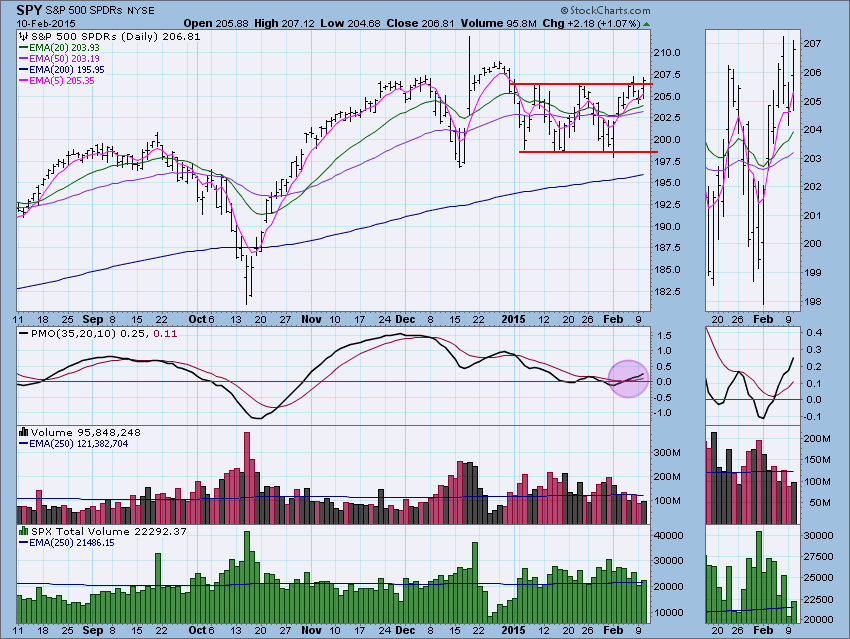
STOCKS: Based upon a 10/31/2014 Trend Model BUY signal, our current intermediate-term market posture for the S&P 500 (SPY) is bullish. The Trend Model, which informs our long-term outlook, is on a BUY signal as of 10/31/2014 so our long-term posture is bullish.
Price finally closed above the horizontal trading range it has been stuck in since the beginning of the year. It was a tiny breakout, but a breakout nonetheless. I added the 5-EMA to the chart and noticed that it crossed over the 20-EMA early last week for a short-term Trend Model BUY. The PMO is still rising without much hesitation, but volume was lower than we'd like to see on a breakout. I pointed out a possible triple-bottom formation last Friday in the DP Weekly Update (located in the DP Reports Blog) so a breakout is good news, although we'd like to see more follow-through.
Ultra-Short-Term Indicators: None of the readings are overly climactic. The Participation Index - UP was elevated, but overall I'd list these indicators as neutral.
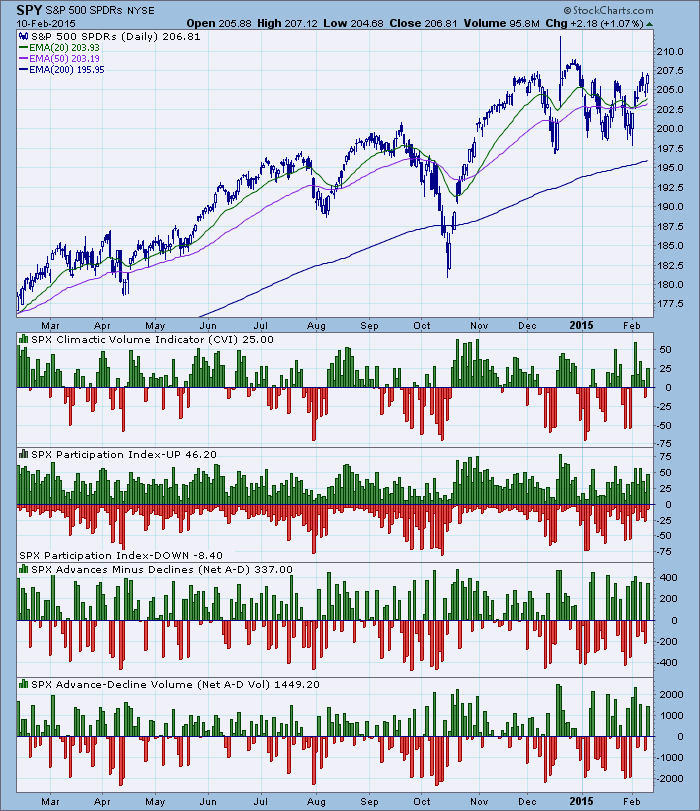
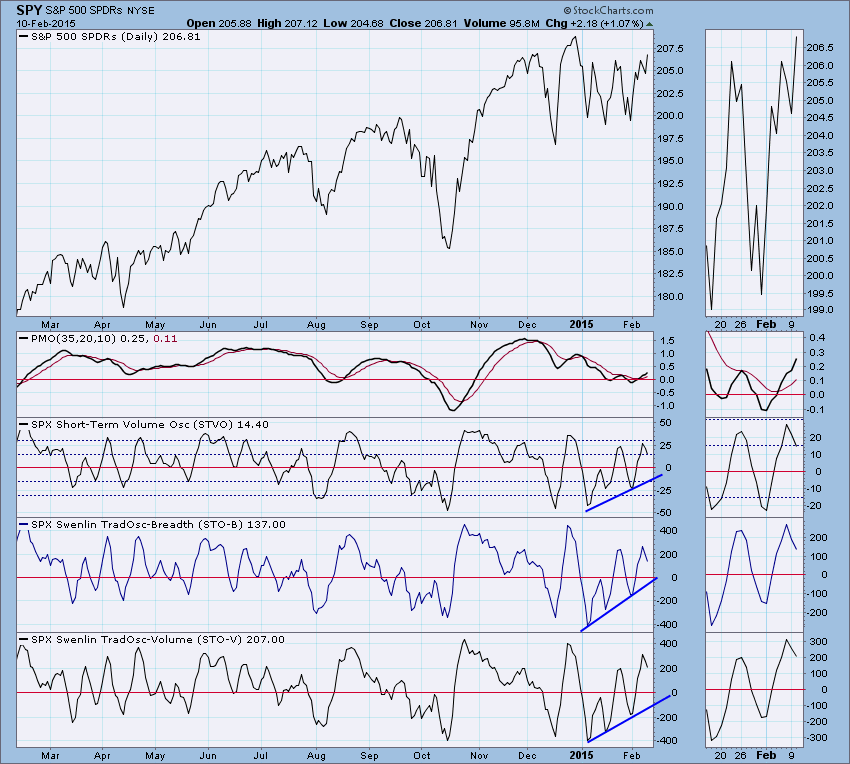
Short-Term Indicators: These indicators started falling yesterday and are continuing to descend. This is bearish. They are still in an upward trend overall which is positive.
Intermediate-Term Indicators: All readings are now above zero which is bullish. After getting the very bullish positive crossovers on the ITBM and ITVM, it is good to see continued upside follow-through.
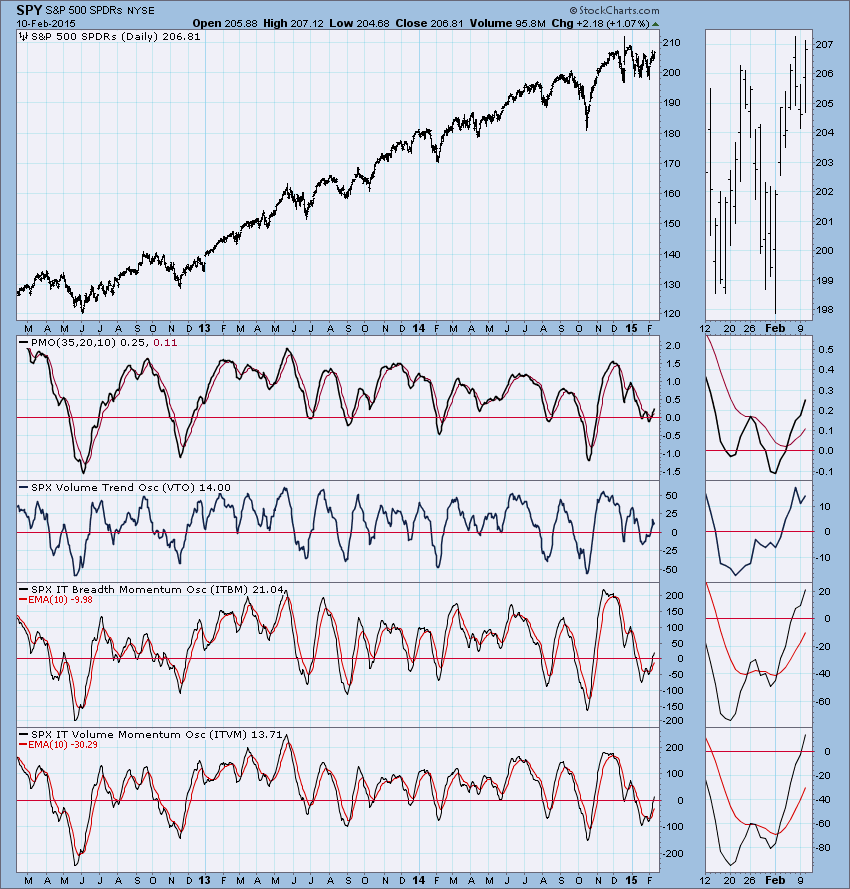
Conclusion: Indicator charts are mixed with short-term indicators bearish and intermediate-term indicators bullish. The trend is sideways. This suggests more consolidation to come, however, today's breakout and positive PMO have me leaning bullish. Would definitely like to see some follow-through tomorrow on today's breakout.
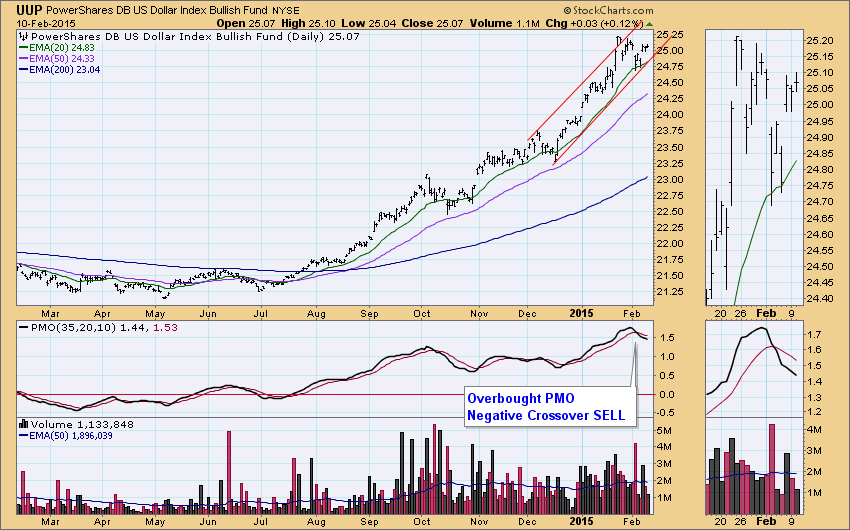
DOLLAR: As of 7/21/2014 the US Dollar Index ETF (UUP) is on a Trend Model BUY signal. The LT Trend Model, which informs our long-term outlook, is on a BUY signal as of 8/21/2014, so our long-term posture is bullish.
I've drawn in a somewhat messy rising trend channel. The negative PMO crossover and continued descent of the PMO is bearish. Price is in the middle of the channel but since momentum is negative it implies the bottom of the channel will likely be challenged.
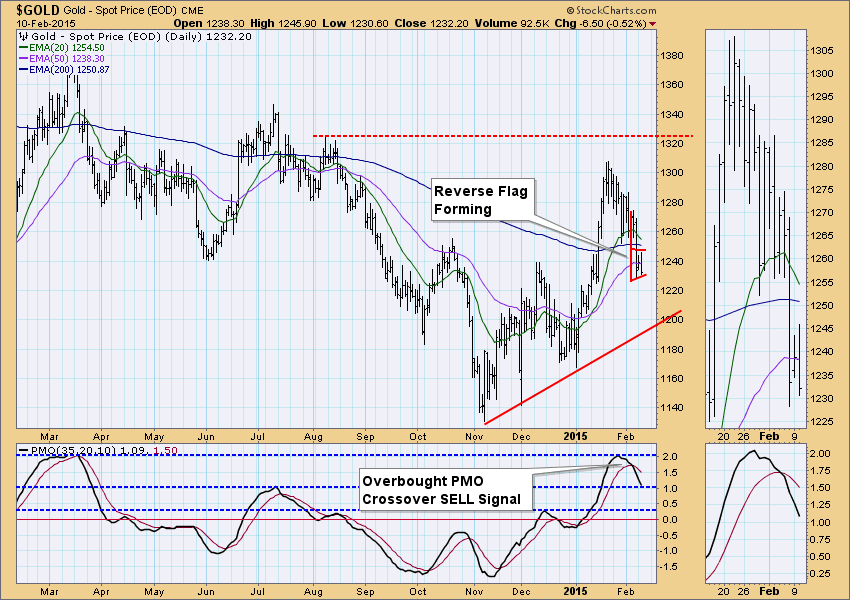
GOLD: As of 1/12/2015 Gold is on a Trend Model BUY signal. The LT Trend Model, which informs our long-term outlook, is on a SELL signal as of 2/15/2013, so our long-term posture is bearish.
The daily PMO for gold had a negative crossover in very overbought territory. Price began to drop off even further after that crossover. It looks like a reverse flag is forming, which interestingly enough, should it execute, would put price right on intermediate-term support. The intermediate-term Trend Model will remain on a BUY signal until the 20-EMA crosses below the 50-EMA. This crossover would occur below the 200-EMA which would move us to a Trend Model SELL signal.
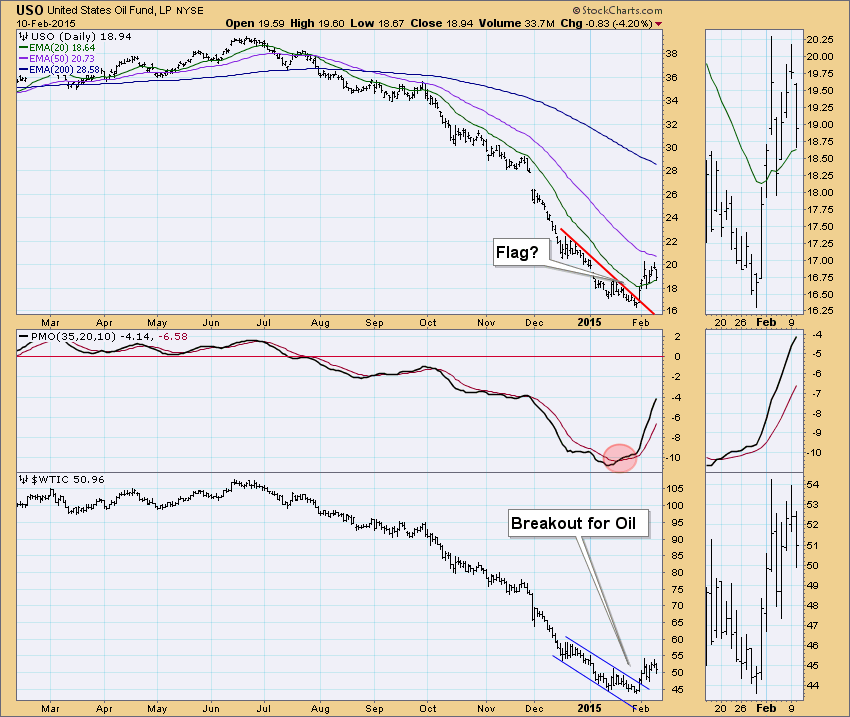
CRUDE OIL (USO): As of 7/30/2014 United States Oil Fund (USO) is on a Trend Model NEUTRAL signal. The LT Trend Model, which informs our long-term outlook, is on a SELL signal as of 8/28/2014, so our long-term posture is bearish.
I'll admit that it is killing me staying on the sidelines with USO right now. There seems to be so much profit potential. The problem (at least for me) is the volatility, I simply don't have the stomach for it. Additionally, while I don't follow fundamentals, it seems that there is too much speculation going on with oil. That said, there is a bullish flag formation on USO and a strongly rising PMO. Price has been able to use the 20-EMA successfully as an area of support which is bullish.
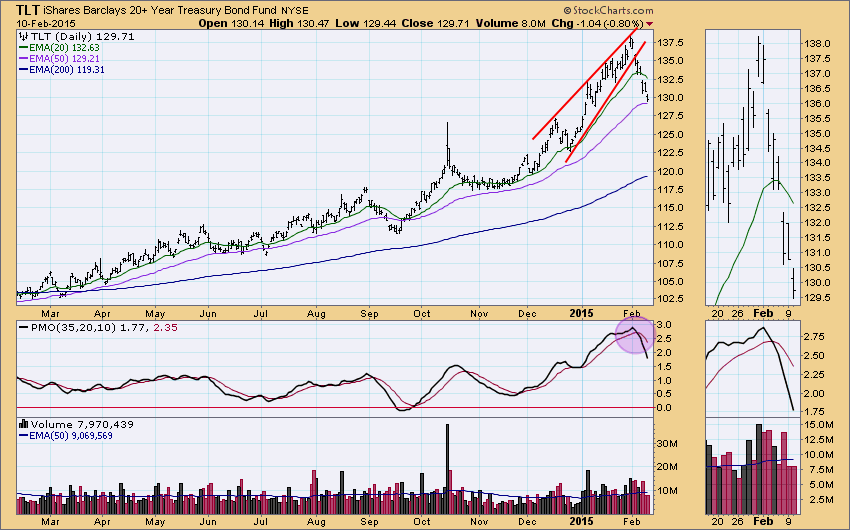
BONDS (TLT): As of 1/17/2014 The 20+ Year T-Bonds ETF (TLT) is on a Trend Model BUY signal. The LT Trend Model, which informs our long-term outlook, is on a BUY signal as of 3/24/2014, so our long-term posture is bullish.
TLT continues to fall since breaking down from the bearish rising wedge. The negative PMO crossover in overbought territory and its continuing drop tell me the decline is not likely over yet.
Technical Analysis is a windsock, not a crystal ball.
** Don't forget to sign up for tomorrow's DecisionPoint LIVE! webinar. I'll be demonstrating how you can use Tracker reports to find investment opportunities, as well as giving you the latest market overview. Sign up here! **
Happy Charting!
- Erin
