 Yesterday, we had a BUY signal light up on our DP Alert Daily Report for XLE, the cap-weighted Energy SPDR and today, a BUY signal was also generated on RYE, the equal-weighted Energy ETF. These were the only two sectors that had been sitting on Neutral signals on the entire table. Let's take a look at their charts and determine why the signals changed and whether this is a new day for the energy sector as a whole.
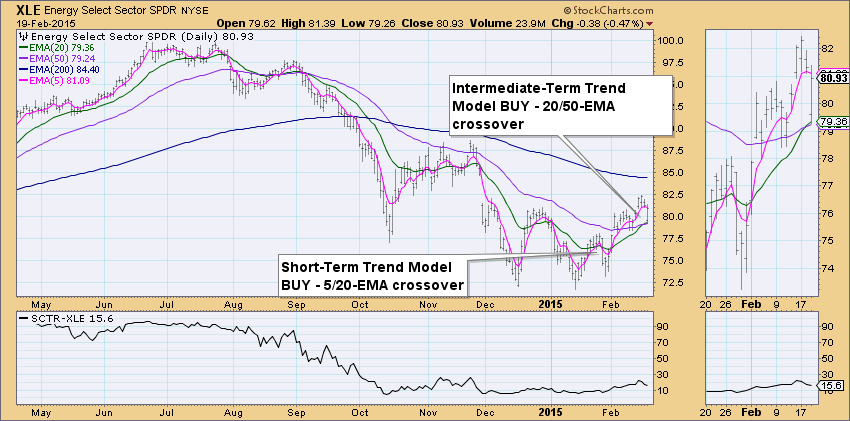
The Intermediate-Term Trend Model BUY signal generated on XLE yesterday because the 20-EMA crossed above the 50-EMA. The location of the 50-EMA in relation to the 200-EMA does not matter on a BUY signal to our Intermediate-Term Trend Model. We also see that the Short-Term Trend Model generated a BUY signal over two weeks ago. It isn't surprising that the SCTR value sank as it did. I would like to see it start to pick up.
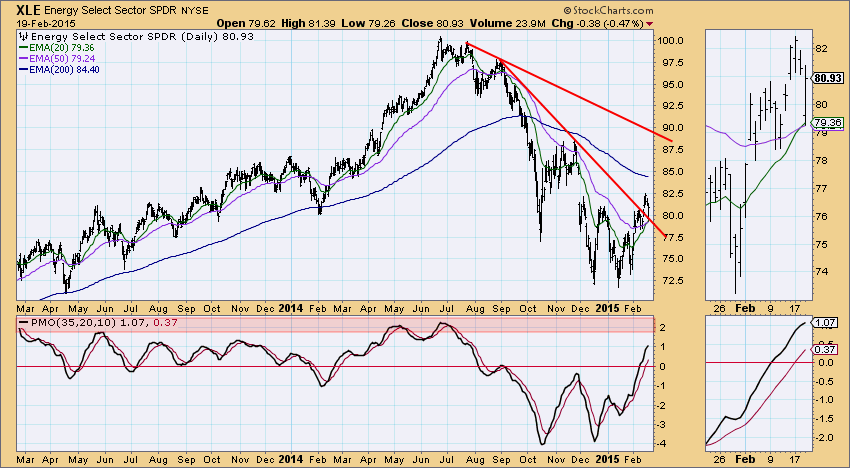
Looking at the Price Momentum Oscillator (PMO) for XLE, it is overbought and heading to extremely overbought territory. That isn't positive. There was PMO BUY signal generated last month and midway it topped but managed to turn back around before it had a negative crossover; that is bullish. The 50-EMA is below the 200-EMA which implies that XLE is in a "bear market". Price broke out and while it looks bad that price dropped as it did, it isn't unexpected. A snapback toward the breakout area or back to the new support line is not unexpected.
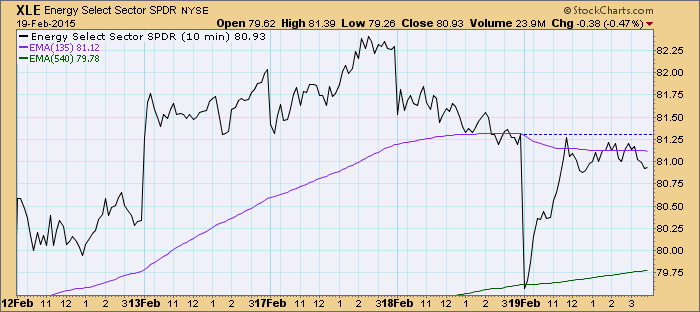
A quick look at the 10-minute bar chart shows us that price opened on that support line and spent the rest of the day bouncing off of it. It did stall when it hit yesterday's close which could be a problem.
Now let's look at RYE, the equal-weight version of the Energy SPDR. Generally our signals do better with the equal-weight versions. You can see that RYE is set up very similarly. The IT and ST Trend Models both generated BUY signals at similar times. The SCTR line is also not positive. It looks like it may be rising, but we need to see much higher readings before we can consider this sector healthy.
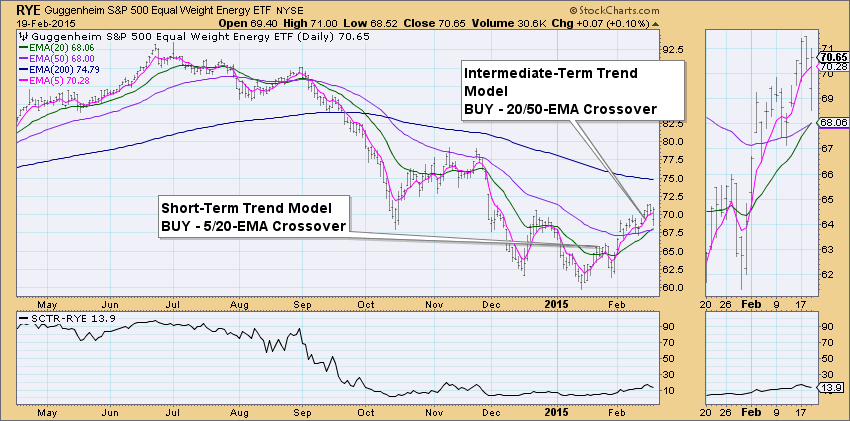
The chart set-up is also about the same. There was a breakout and snapback, additionally the PMO is nearing overbought extremes.
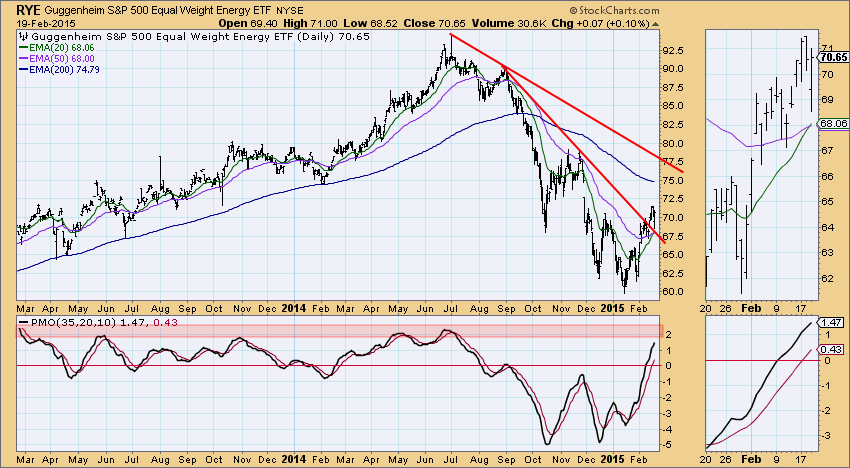
It is obvious from the charts above that the energy sector has been hit hard. SCTR values are very low. I like the set-up of the chart pattern and the Trend Model BUY signals, but the overbought PMOs are concerning, it implies that there is upside potential but it may be limited.
Don't forget to sign up to attend my next DecisionPoint LIVE! webinar next Wednesday, February 25th. Here is a link to the sign up page. Be sure to tweet your chart requests @_DecisionPoint for guaranteed review or bring them and it might be chosen for review at the end of the program.
Happy Charting!
Erin
