There were some exciting charts and interesting Trend Model signal changes today. We will look at the Oil breakout and determine if this is finally a buying opportunity for USO. Rydex Asset analysis suggests a possible price bottom for the market.
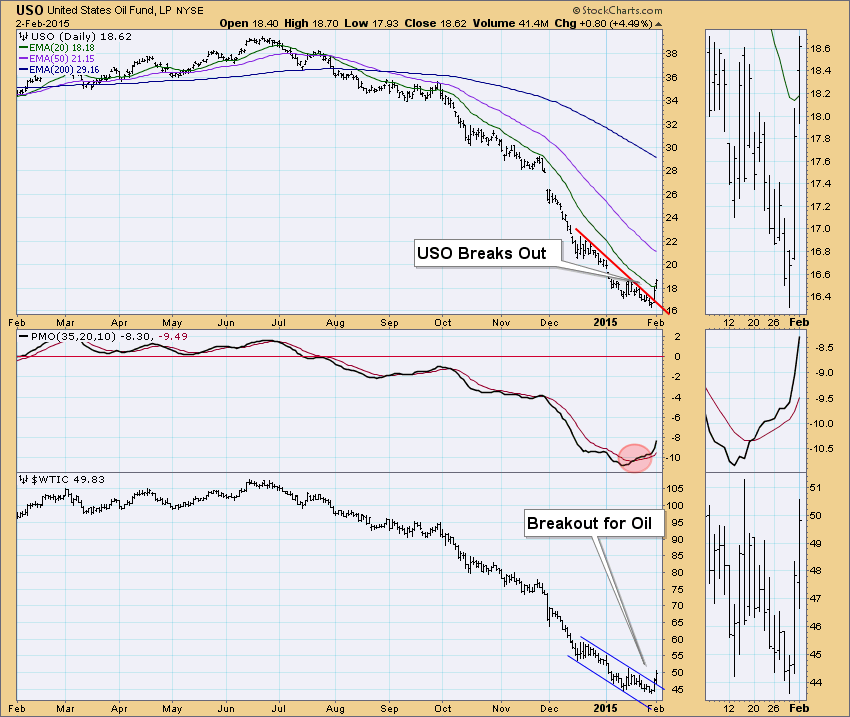
United States Oil Fund (USO) finally had a significant breakout from what appeared to be a never ending decline. Note that Oil finally broke out which is of course responsible for the breakout in the (USO). The big question now is "Can we believe this is the price bottom we've been waiting for?". Looking at the chart below, it looks very positive. Friday's breakout was impressive following on the heels of a recent Price Momentum Oscillator (PMO) BUY signal, but today price broke and closed above the 20-EMA. An attempt at a breakout occurred in September when price also broke above the 20-EMA, but it was a false positive. The difference between then and now is a healthy PMO and a breakout in oil.
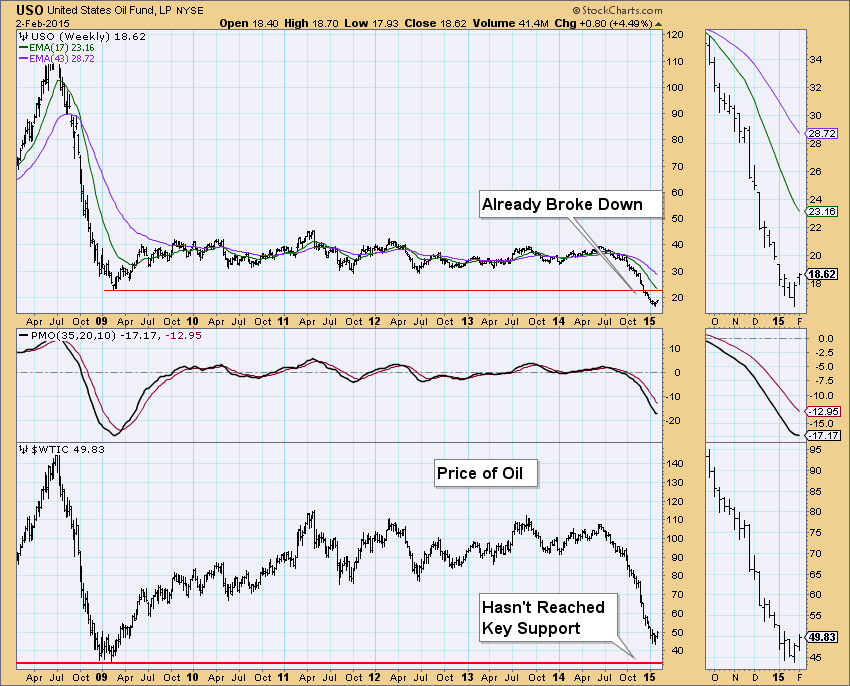
But is this enough? As I mentioned in my webinar last Wednesday, I had difficulty buying into the Gold PMO BUY signal. Even when it was followed by a 20-EMA positive crossover the 50-EMA that generated a Trend Model BUY signal. USO has much distance to cover before it will generate a Trend Model BUY signal. Additionally, looking at the weekly chart below, I have concerns that oil prices still haven't tested long-term support and gravity could pull it back down to that support level. The weekly PMO is still very negative.
There were three Intermediate-Term Trend Model Neutral signals generated today (see excerpt from the DP Alert Daily Report). We will look at the Dow ETF (DIA) and the Technology equal-weight ETF (RYT).
DECISIONPOINT ALERT DAILY REPORT
Monday, 2/2/2015

************************ DECISIONPOINT MARKET POSTURE *************************************

The following is the market posture suggested by our mechanical trend-
following tools. These are not trading recommendations, rather they are price
activity flags that should be qualified by chart analysis. The Trend Model is
used on all indexes.


                                     Days   Index     02/02   Points  Percent   Prev Signal
Index               Posture     Date Elap  @Start     Close      P/L      P/L     P/L  Days
------------------- ------- -------- ---- -------   -------  -------  ------- ------- -----
Dow           (DIA) Neutral 02/02/15    0   173.27   173.27 * Changed Today *   +0.5%    94
Materials EWt (RTM) Neutral 02/02/15    0    82.70    82.70 * Changed Today *   -1.1%    10
Technolgy EWt (RYT) Neutral 02/02/15    0    87.21    87.21 * Changed Today *   +0.2%    90
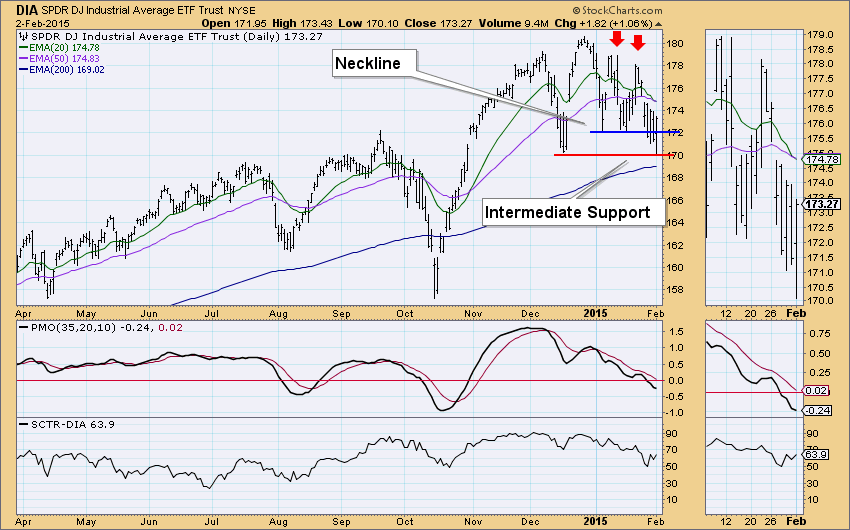
On both DIA and RYT, the 20-EMA crossed below the 50-EMA while the 50-EMA was above the 200-EMA which is a Neutral signal. A Trend Model SELL signal is only generated if the 20-EMA crosses below the 50-EMA while it is below the 200-EMA. The chart set-ups are different though.
DIA has a double-top chart pattern visible. Price broke down below the neckline a few times in the past week, most significant would be Friday when it closed below. Today price reached horizontal support at the December low and then rebounded back above the neckline which is positive. However, the double-top pattern is still viable in my opinion based on the intraday highs/lows still trending lower. Additionally, a Trend Model Neutral signal is concerning.
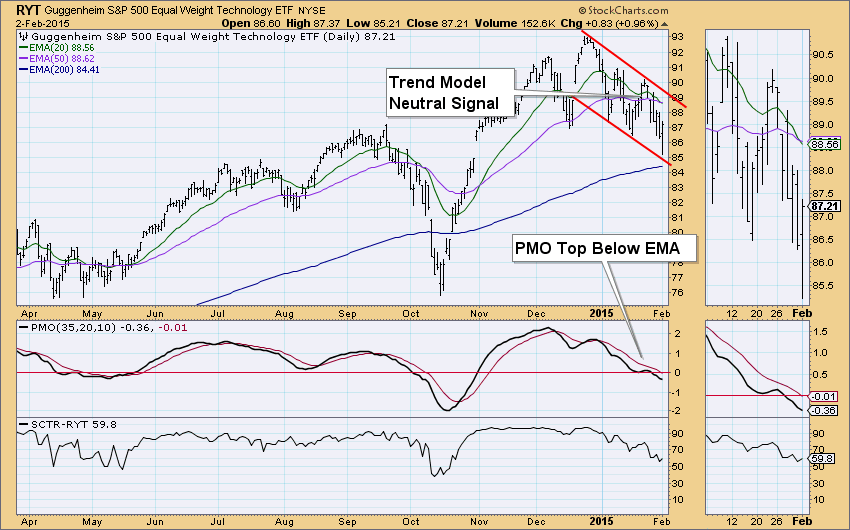
On RYT you could make a case for a double-top that would look much like DIA's above. However, I think the declining trend channel is more dominant. The PMO topped below its EMA over a week ago which is especially bearish when coupled with a Trend Model Neutral signal and a declining price channel.
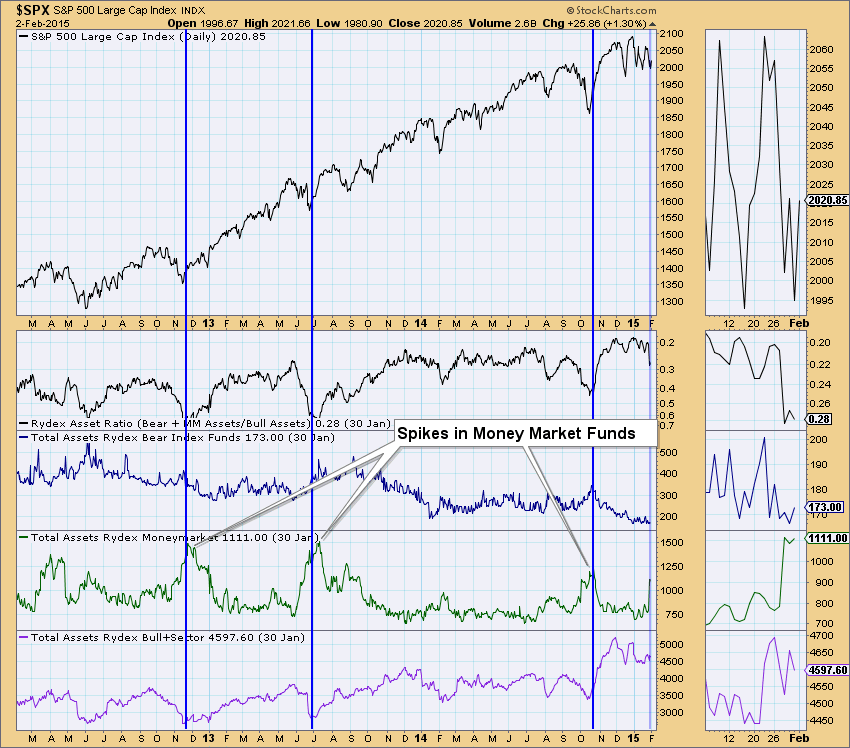
We have been discussing the market as a whole being in trouble in our previous blogs. I still believe the market is in a precarious position with double-tops, consolidation channels and PMOs topping below EMAs but one of the DecisionPoint sentiment indicators, the Rydex Assets analysis. The idea is that we follow the money. We watch when assets increase or decrease in bear and money market funds versus bull funds. The chart below suggests a price bottom could be approaching. Money market funds jumped higher last week. Spikes in cash suggest sentiment is bearish. The set-up is very similar to previous major market bottoms, but we are missing oversold bottoms in the PMO and assets in bull funds as well as an increase in Rydex bear funds assets. The Rydex Ratio is still far from oversold as well. It is important to be aware of where assets are accumulating.
Happy Charting!
Erin
