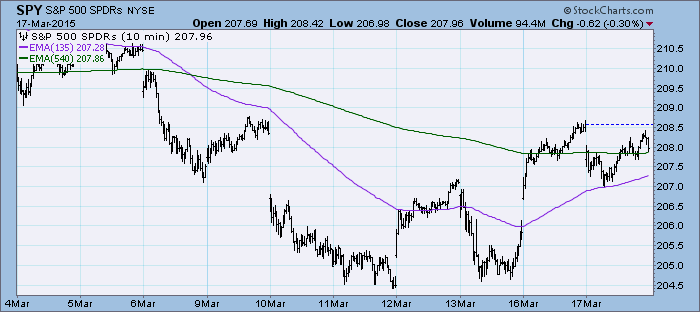
Price didn't do much today, spending the majority nearly all day in the red. After hitting the intraday low, it trended up and managed to recoup about half of the day's losses.
The purpose of the DecisionPoint Daily Update is to quickly review the day's action, internal condition, and Trend Model status of the broad market (S&P 500), the nine SPDR Sectors, the U.S. Dollar, Gold, Crude Oil, and Bonds. To ensure that using this daily reference will be quick and painless, we are as brief as possible, and often we let a chart speak for itself.
SIGNALS: Here we include the current day's signal table, an excerpt from the DecisionPoint Alert Daily Report.
DECISIONPOINT ALERT DAILY REPORT
Tuesday, 3/17/2015

************************ DECISIONPOINT MARKET POSTURE ***********************

The following is the market posture suggested by our mechanical trend-
following tools. These are not trading recommendations, rather they are price
activity flags that should be qualified by chart analysis. The Trend Model is
used on all indexes.


                                     Days   Index     03/17   Points  Percent
Index               Posture     Date Elap  @Start     Close      P/L      P/L
------------------- ------- -------- ---- -------   -------  -------  -------
Stocks Medium-Term  Bullish 10/31/14  137   200.55   207.96    +7.41    +3.7%
Stocks Long-Term    Bullish 10/31/14  137   200.55   207.96    +7.41    +3.7%
Gold (NY Spot)      Bearish 02/23/15   22  1200.80  1148.20   +52.60    +4.4%
20+Yr T-Bond  (TLT) Neutral 03/06/15   11   123.50   129.00     ....     ....
------------------- ------- -------- ---- -------   -------  -------  -------
Dollar Index  (UUP) Bullish 07/21/14  239    21.47    26.30    +4.83   +22.5%
Commodities   (GSG) Neutral 07/14/14  246    32.64    19.01     ....     ....
Crude Oil     (USO) Neutral 07/30/14  230    36.92    15.96     ....     ....
------------------- ------- -------- ---- -------   -------  -------  -------
S&P 500       (SPY)     BUY 10/31/14  137   200.55   207.96    +7.41    +3.7%
S&P Equal Wt  (RSP)     BUY 11/03/14  134    77.77    81.01    +3.24    +4.2%
Dow           (DIA)     BUY 02/03/15   42   175.85   178.50    +2.65    +1.5%
Nasdaq 100    (QQQ)     BUY 10/29/14  139    99.44   106.84    +7.40    +7.4%
NDX Equal Wt (QQEW)     BUY 10/30/14  138    40.52    44.14    +3.62    +8.9%
S&P 100       (OEF)     BUY 02/04/15   41    89.96    91.45    +1.49    +1.7%
S&P 400 MidCp (IJH)     BUY 11/05/14  132   141.11   151.12   +10.01    +7.1%
S&P 600 SmlCp (IJR)     BUY 11/03/14  134   110.95   116.96    +6.01    +5.4%
Total Market  (VTI)     BUY 11/03/14  134   103.53   108.00    +4.47    +4.3%
Consumer Disc (XLY)     BUY 11/05/14  132    67.27    75.62    +8.35   +12.4%
Cons Disc EWt (RCD)     BUY 11/03/14  134    82.65    90.94    +8.29   +10.0%
Consumer Stpl (XLP)     BUY 08/20/14  209    44.27    48.52    +4.25    +9.6%
Cons Stpl EWt (RHS)     BUY 10/21/14  147    97.79   106.09    +8.30    +8.5%
Energy        (XLE)    SELL 03/05/15   12    78.18    75.35    +2.83    +3.6%
Energy EWt    (RYE)    SELL 03/06/15   11    65.78    63.57    +2.21    +3.4%
Financial     (XLF)     BUY 02/13/15   32    24.43    24.56    +0.13    +0.5%
Financial EWt (RYF)     BUY 02/05/15   40    44.36    45.13    +0.77    +1.7%
Health Care   (XLV)     BUY 10/23/14  145    64.07    73.19    +9.12   +14.2%
Health Cr EWt (RYH)     BUY 05/09/14  312   115.84   155.55   +39.71   +34.3%
Industrial    (XLI)     BUY 10/30/14  138    54.37    56.78    +2.41    +4.4%
Industrl EWt  (RGI)     BUY 02/09/15   36    88.82    90.47    +1.65    +1.9%
Materials     (XLB)     BUY 02/05/15   40    50.04    49.21    -0.83    -1.7%
Materials EWt (RTM)     BUY 02/03/15   42    85.23    86.03    +0.80    +0.9%
Technology    (XLK)     BUY 02/09/15   36    41.04    41.99    +0.95    +2.3%
Technolgy EWt (RYT)     BUY 02/05/15   40    89.61    92.49    +2.88    +3.2%
Utilities     (XLU) Neutral 02/20/15   25    45.69    44.16     ....     ....
Utilities EWt (RYU) Neutral 02/25/15   20    76.90    74.54     ....     ....

Average                                96                               +6.1%
NOTE: Mechanical trading model signals define the implied bias of the price index based upon moving average relationships, but they do not necessarily call for a specific action. They are information flags that should prompt chart review. Further, they do not call for continuous buying or selling during the life of the signal. For example, a BUY signal will probably return the best results if action is taken soon after the signal is generated. Additional opportunities for buying may be found as price zigzags higher, but the trader must look for optimum entry points. Conversely, exit points to preserve gains (or minimize losses) may be evident before the model mechanically closes the signal.
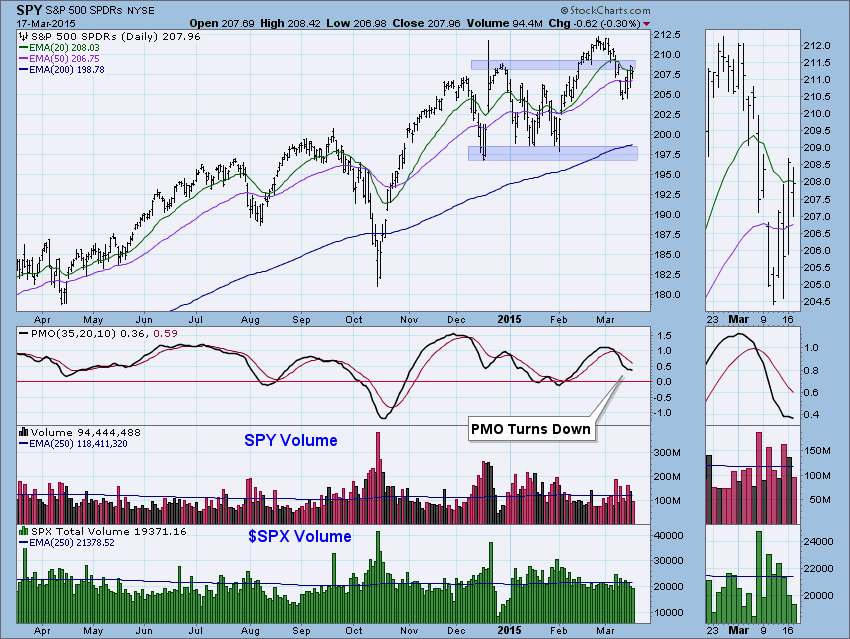
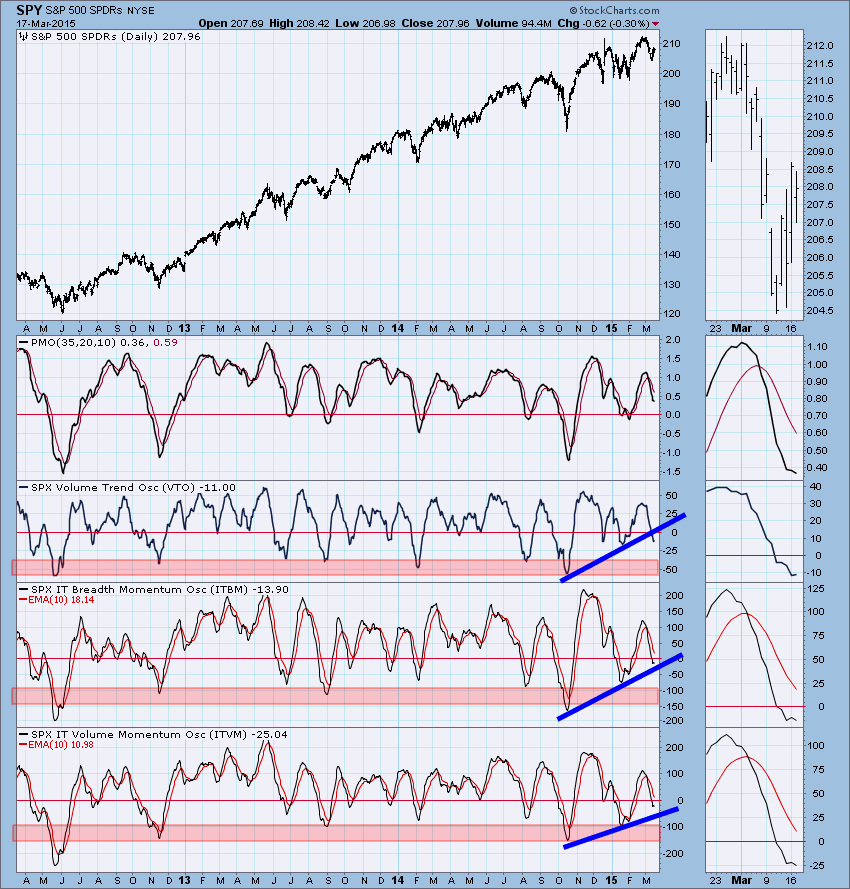
STOCKS: Based upon a 10/31/2014 Trend Model BUY signal, our current intermediate-term market posture for the S&P 500 (SPY) is bullish. The Trend Model, which informs our long-term outlook, is on a BUY signal as of 10/31/2014 so our long-term posture is bullish.
Having met resistance, price turned lower. It appeared after hitting a short-term price bottom that the market would make a run back toward last month's highs, it's failed so far. After yesterday's positive move, the PMO had turned up, but today it turned back down below its EMA which is bearish.
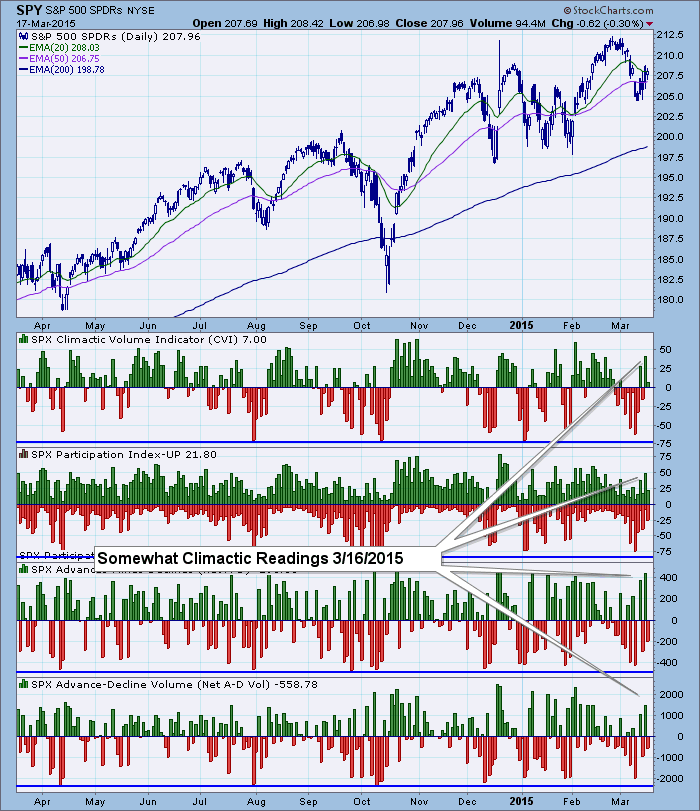
Ultra-Short-Term Indicators: Readings for today were uneventful, but looking at yesterday, we see that readings were elevated. It appears that was an exhaustion climax as prices turned back down today.
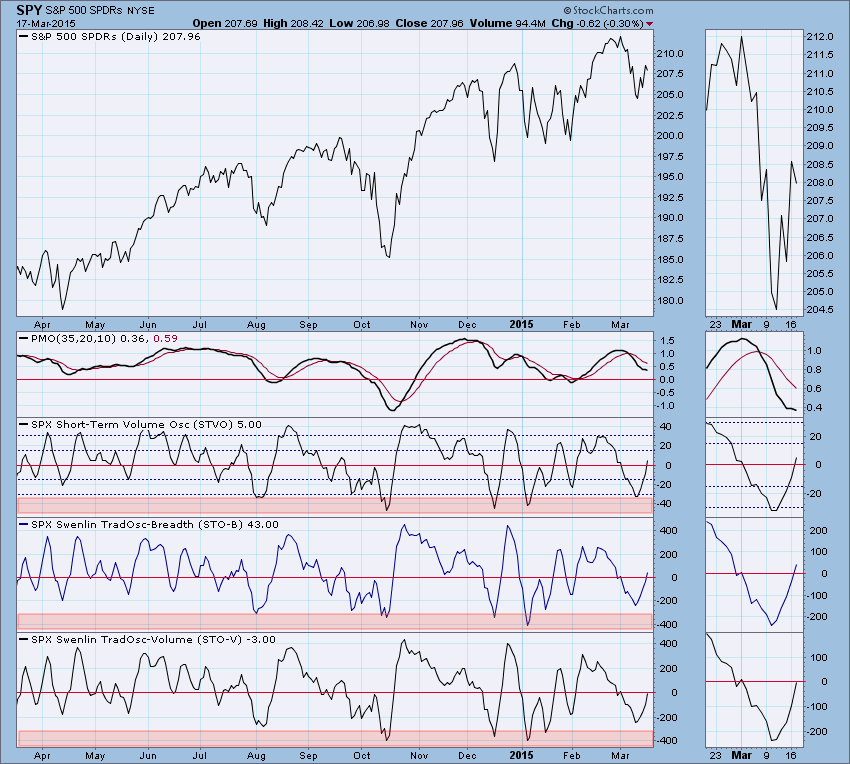
Short-Term Indicators: Indicators are rising which is bullish and likely symptomatic of price movement since this month's low. There could be some more upside movement based on these indicators as they are in neutral territory and not overbought yet.
Intermediate-Term Indicators: Mixed readings among the ITBM/ITVM and VTO. Both the ITBM and ITVM had turned up yesterday, but turned right back down today. Anytime we see an indicator turn down below its EMA, it is generally very bearish. The VTO turned up today, but we also see that the rising trend it was in, was breached today, so any positive energy from the bottom is taken away by the break of the trend.
Conclusion: The market hit the pause button when it reached overhead resistance. The minutes from the FMOC meeting tomorrow will be released later in the day tomorrow and that likely has put some investors in "wait and see" mode. The results of the meeting are likely to be dovish as far as raising interest rates which should have a positive effect on price. That would fall in line with short-term indicators, but with bearish intermediate-term indicators I would expect any rally to be short-lived.
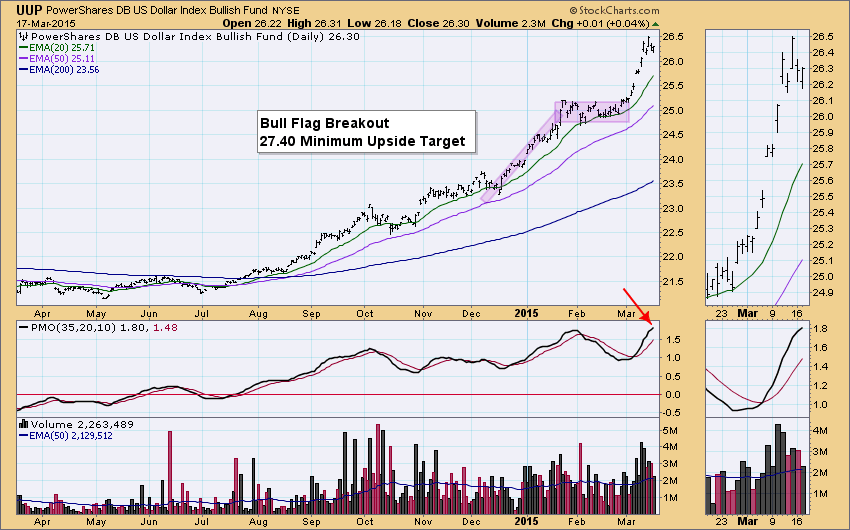
DOLLAR: As of 7/21/2014 the US Dollar Index ETF (UUP) is on a Trend Model BUY signal. The LT Trend Model, which informs our long-term outlook, is on a BUY signal as of 8/21/2014, so our long-term posture is bullish.
UUP is consolidating and likely taking a much needed pause to digest this month's near straight up rally. The PMO is rising suggesting that positive momentum is intact, but it is starting to slow and may be making a top in overbought territory. Will be interesting to see where it is tomorrow when I do the DecisionPoint Webinar market review. Sign up for the webinar here.
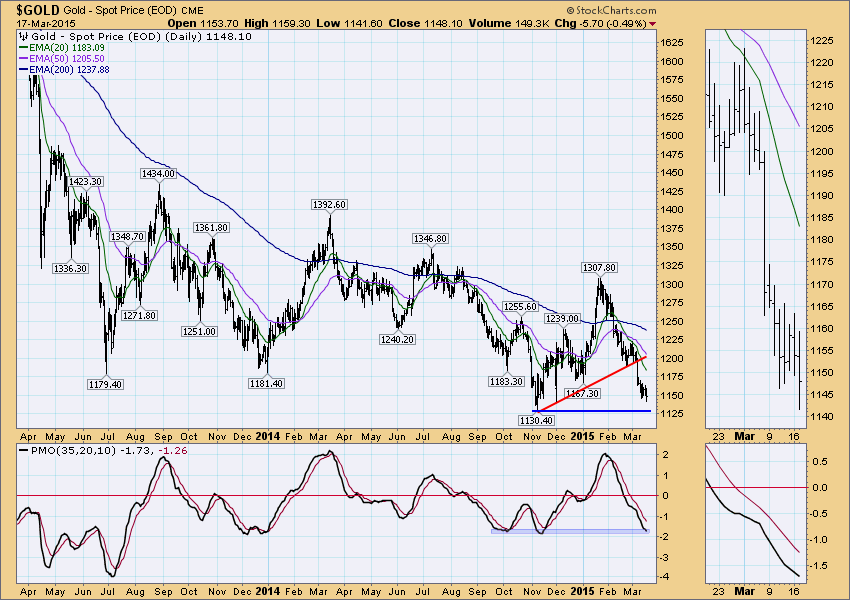
GOLD: As of 2/23/2015 Gold is on a Trend Model SELL signal. The LT Trend Model, which informs our long-term outlook, is on a SELL signal as of 2/15/2013, so our long-term posture is bearish.
Gold will likely test support at the November low at 1130.40. Looking at a one-year chart versus the two-year chart below, it appears that the PMO is oversold, however a longer-term view shows that it is far from oversold. That's definitely bad news for gold.
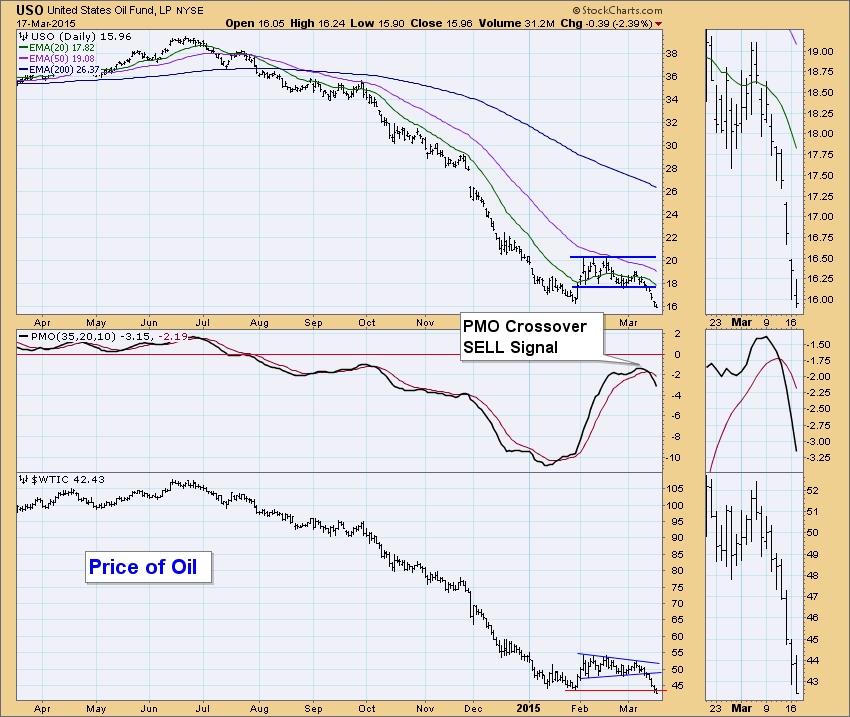
CRUDE OIL (USO): As of 7/30/2014 United States Oil Fund (USO) is on a Trend Model NEUTRAL signal. The LT Trend Model, which informs our long-term outlook, is on a SELL signal as of 8/28/2014, so our long-term posture is bearish.
USO hit new all-time lows today. The PMO crossover SELL signal that generated last week occurred below the zero line which is very bearish. I'm sure there will eventually be a buying opportunity on oil, but it doesn't appear to be here yet. In fact, yesterday and today, the price of Oil hit new multi-year lows the last two days breaking slightly below support at the January lows.
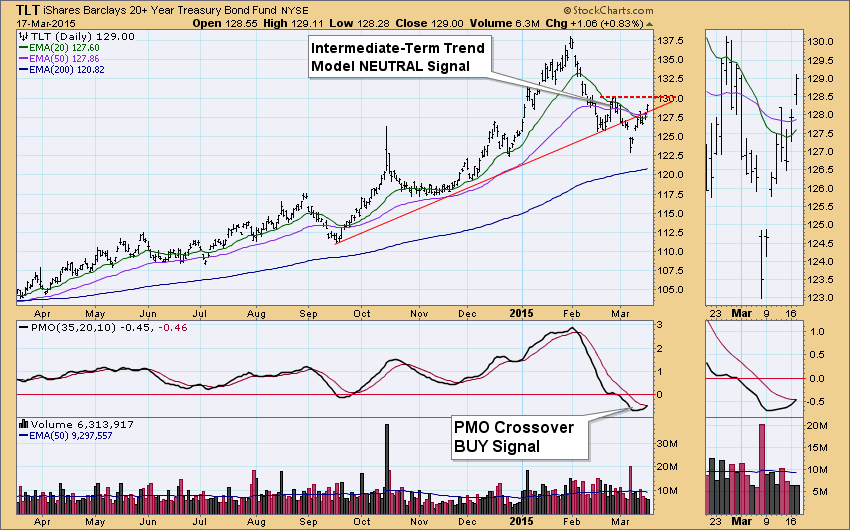
BONDS (TLT): As of 3/6/2015 The 20+ Year T-Bonds ETF (TLT) is on a Trend Model Neutral signal. The LT Trend Model, which informs our long-term outlook, is on a BUY signal as of 3/24/2014, so our long-term posture is bullish.
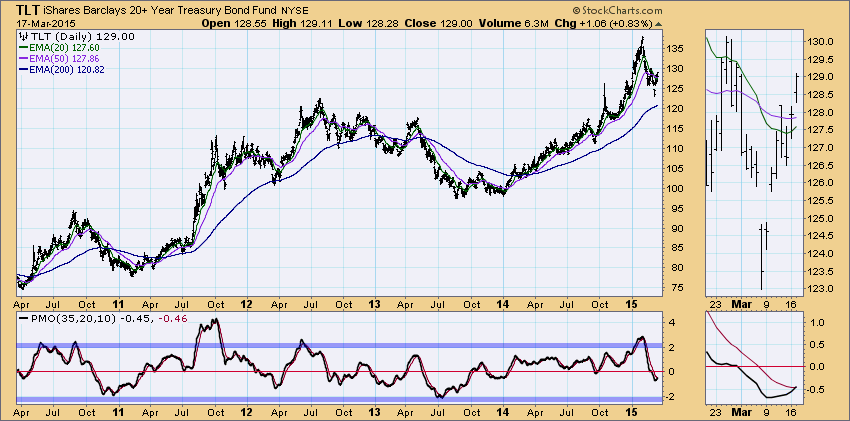
TLT rallied today to break back above the rising bottoms trend line. It is approaching short-term resistance at the February high. The big news for TLT is that the PMO crossed above its 10-EMA to generate a PMO BUY signal. As far as the past year is concerned, the PMO is "oversold", but a look at a longer-term chart shows that it is far from oversold. The DecisionPoint intermediate-term Trend Model will not move from a Neutral stance until the 20-EMA crosses above the 50-EMA.
Technical Analysis is a windsock, not a crystal ball.
Happy Charting!
- Erin
