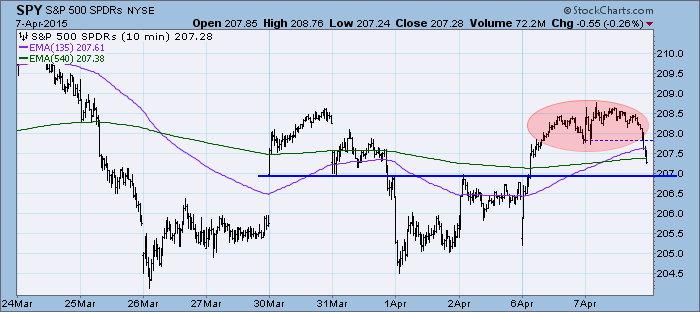
The market was mostly in a holding pattern today until the final 20 minutes when price broke down to close in the red. Ultra-short-term support is lurking, while a second area of support is waiting at the March 26th low.
The purpose of the DecisionPoint Daily Update is to quickly review the day's action, internal condition, and Trend Model status of the broad market (S&P 500), the nine SPDR Sectors, the U.S. Dollar, Gold, Crude Oil, and Bonds. To ensure that using this daily reference will be quick and painless, we are as brief as possible, and often we let a chart speak for itself.
SIGNALS: Here we include the current day's signal table, an excerpt from the DecisionPoint Alert Daily Report.
DECISIONPOINT ALERT DAILY REPORT
Tuesday, 4/7/2015

************************ DECISIONPOINT MARKET POSTURE ***********************

The following is the market posture suggested by our mechanical trend-
following tools. These are not trading recommendations, rather they are price
activity flags that should be qualified by chart analysis. The Trend Model is
used on all indexes.


                                     Days   Index     04/07   Points  Percent
Index               Posture     Date Elap  @Start     Close      P/L      P/L
------------------- ------- -------- ---- -------   -------  -------  -------
Stocks Medium-Term  Bullish 10/31/14  158   199.66   207.28    +7.62    +3.8%
Stocks Long-Term    Bullish 10/31/14  158   199.66   207.28    +7.62    +3.8%
Gold (NY Spot)      Bearish 02/23/15   43  1200.80  1210.60    -9.80    -0.8%
20+Yr T-Bond  (TLT) Bullish 03/19/15   19   130.55   131.09    +0.54    +0.4%
------------------- ------- -------- ---- -------   -------  -------  -------
Dollar Index  (UUP) Bullish 07/21/14  260    21.47    25.80    +4.33   +20.2%
Commodities   (GSG) Neutral 07/14/14  267    32.64    20.52     ....     ....
Crude Oil     (USO) Neutral 07/30/14  251    36.92    19.06     ....     ....
------------------- ------- -------- ---- -------   -------  -------  -------
S&P 500       (SPY)     BUY 10/31/14  158   199.66   207.28    +7.62    +3.8%
S&P Equal Wt  (RSP)     BUY 11/03/14  155    77.46    81.53    +4.07    +5.3%
Dow           (DIA)     BUY 02/03/15   63   175.55   178.42    +2.87    +1.6%
Nasdaq 100    (QQQ)     BUY 10/29/14  160    99.21   105.80    +6.59    +6.6%
NDX Equal Wt (QQEW)     BUY 10/30/14  159    40.47    43.91    +3.44    +8.5%
S&P 100       (OEF)     BUY 02/04/15   62    89.49    90.68    +1.19    +1.3%
S&P 400 MidCp (IJH)     BUY 11/05/14  153   140.67   152.00   +11.33    +8.1%
S&P 600 SmlCp (IJR)     BUY 11/03/14  155   110.56   117.76    +7.20    +6.5%
Total Market  (VTI)     BUY 11/03/14  155   103.05   107.77    +4.72    +4.6%
Consumer Disc (XLY)     BUY 11/05/14  153    67.05    75.63    +8.58   +12.8%
Cons Disc EWt (RCD)     BUY 11/03/14  155    82.41    91.65    +9.24   +11.2%
Consumer Stpl (XLP)     BUY 08/20/14  230    44.00    49.29    +5.29   +12.0%
Cons Stpl EWt (RHS)     BUY 10/21/14  168    97.26   109.47   +12.21   +12.6%
Energy        (XLE)    SELL 03/05/15   33    77.65    79.17    -1.52    -2.0%
Energy EWt    (RYE)    SELL 03/06/15   32    65.36    68.70    -3.34    -5.1%
Financial     (XLF)     BUY 02/13/15   53    24.34    24.12    -0.22    -0.9%
Financial EWt (RYF)     BUY 02/05/15   61    44.13    44.52    +0.39    +0.9%
Health Care   (XLV)     BUY 10/23/14  166    63.89    72.27    +8.38   +13.1%
Health Cr EWt (RYH)     BUY 05/09/14  333   115.73   154.64   +38.91   +33.6%
Industrial    (XLI) Neutral 04/02/15    5    55.43    55.72     ....     ....
Industrl EWt  (RGI)     BUY 02/09/15   57    88.54    89.54    +1.00    +1.1%
Materials     (XLB) Neutral 03/27/15   11    48.61    49.28     ....     ....
Materials EWt (RTM) Neutral 04/06/15    1    86.26    86.20     ....     ....
Technology    (XLK)     BUY 02/09/15   57    40.87    41.68    +0.81    +2.0%
Technolgy EWt (RYT)     BUY 02/05/15   61    89.42    92.00    +2.58    +2.9%
Utilities     (XLU) Neutral 02/20/15   46    45.33    44.65     ....     ....
Utilities EWt (RYU) Neutral 02/25/15   41    75.94    75.00     ....     ....

Average                               107                               +6.4%
NOTE: Mechanical trading model signals define the implied bias of the price index based upon moving average relationships, but they do not necessarily call for a specific action. They are information flags that should prompt chart review. Further, they do not call for continuous buying or selling during the life of the signal. For example, a BUY signal will probably return the best results if action is taken soon after the signal is generated. Additional opportunities for buying may be found as price zigzags higher, but the trader must look for optimum entry points. Conversely, exit points to preserve gains (or minimize losses) may be evident before the model mechanically closes the signal.
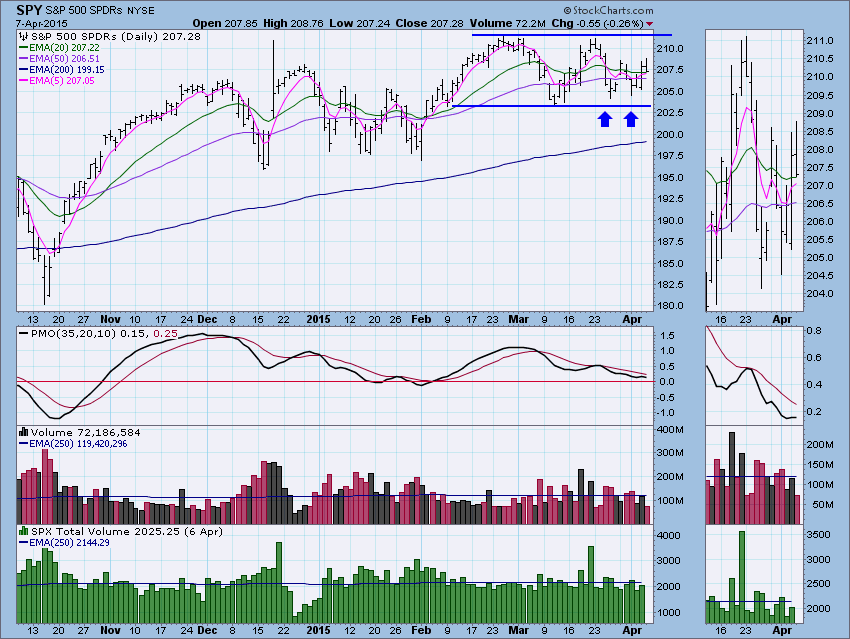
STOCKS: Based upon a 10/31/2014 Trend Model BUY signal, our current intermediate-term market posture for the S&P 500 (SPY) is bullish. The Trend Model, which informs our long-term outlook, is on a BUY signal as of 10/31/2014 so our long-term posture is bullish.
Looking at a six-month daily chart for the SPY, we see that the double-top formation was aborted when price failed to penetrate the neckline. But all is not well. After price bounced off of support, it failed twice to reach resistance at the all-time highs. There is a short-term double-bottom formation, but even if it executes it would only bring price just above resistance. Today's market action shown on the 10-minute bar chart shows that price reached the neckline but was turned back. It is still viable, but at this time I suspect we are in for more ups and downs within support and resistance before a breakout in either direction. The PMO has flattened which tells us that momentum is neutral which also implies more consolidation.
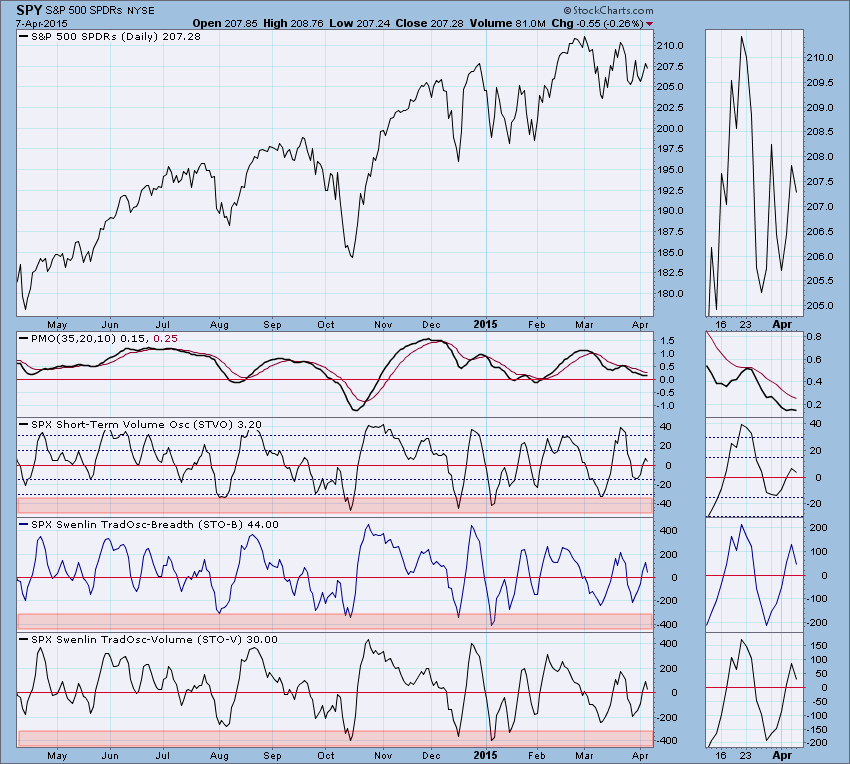
Ultra-Short-Term Indicators: Nothing particularly interesting on our ultra-short-term indicators for the last week. At this point, I would rate these indicators "neutral".
Short-Term Indicators: Short-term indicators stopped short and topped before reaching overbought territory. This is bearish and reflects the market's indecision as of late.
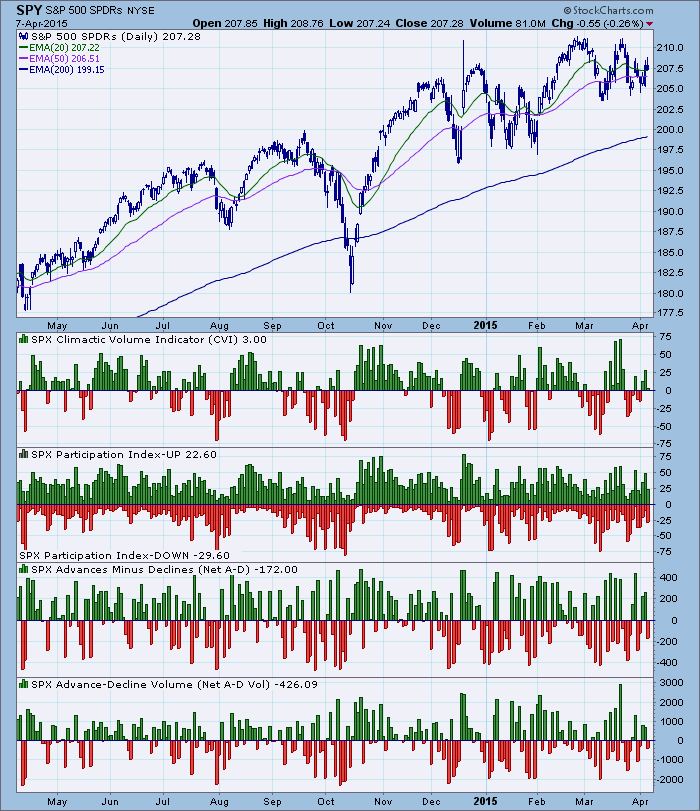
Intermediate-Term Indicators: All are rising and the ITBM even had a positive crossover. Readings are still stilted and noisy, again, likely due to the wavering price behavior as it consolidates. The ITBM had a positive crossover its EMA which is quite positive and the ITVM will likely make that crossover tomorrow.
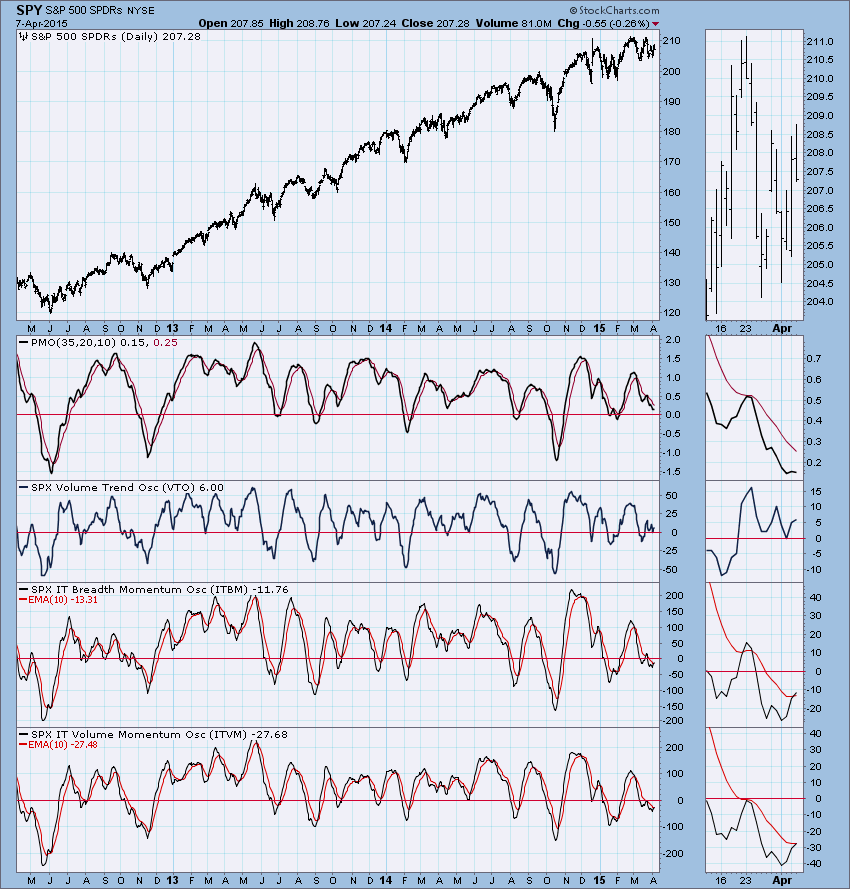
Conclusion: The market continues to trade within the trading range formed by resistance at the all-time highs and support at the March low. It doesn't seem particularly interested in breaking out one way or the other just yet. Ultra-short and short-term indicators are mostly neutral to somewhat bearish telling us to expect more of this continuation pattern. Intermediate-term indicators are looking fairly good, so once this indecision is done, we should see higher prices again if they are correct.
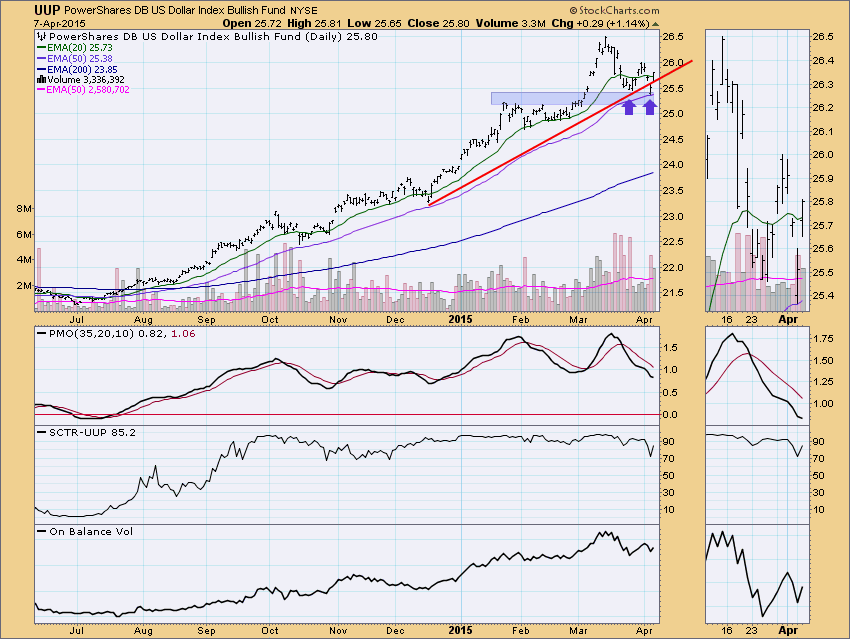
DOLLAR: As of 7/21/2014 the US Dollar Index ETF (UUP) is on a Trend Model BUY signal. The LT Trend Model, which informs our long-term outlook, is on a BUY signal as of 8/21/2014, so our long-term posture is bullish.
It looked like the dollar was on its way to breaking down, but today it recovered after bouncing off of support yesterday. Price still hasn't broken above the short-term declining tops line (visible in the thumbnail) which could be a problem. The PMO is still declining.
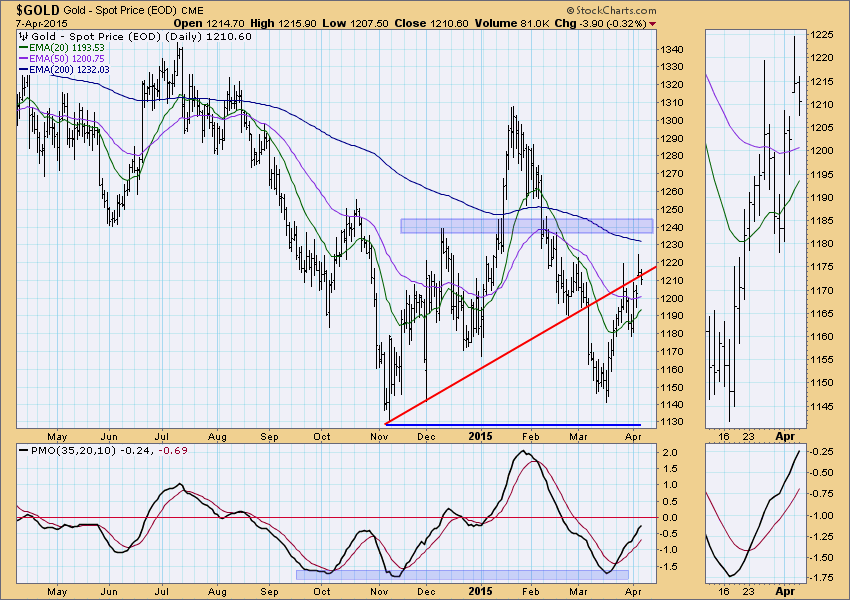
GOLD: As of 2/23/2015 Gold is on a Trend Model SELL signal. The LT Trend Model, which informs our long-term outlook, is on a SELL signal as of 2/15/2013, so our long-term posture is bearish.
Gold had broken above the rising bottoms trend line yesterday and traded above it all day. However, today it lost some ground, moving back below. The PMO is rising and the first area of resistance is about $30 away which would offer some upside potential.
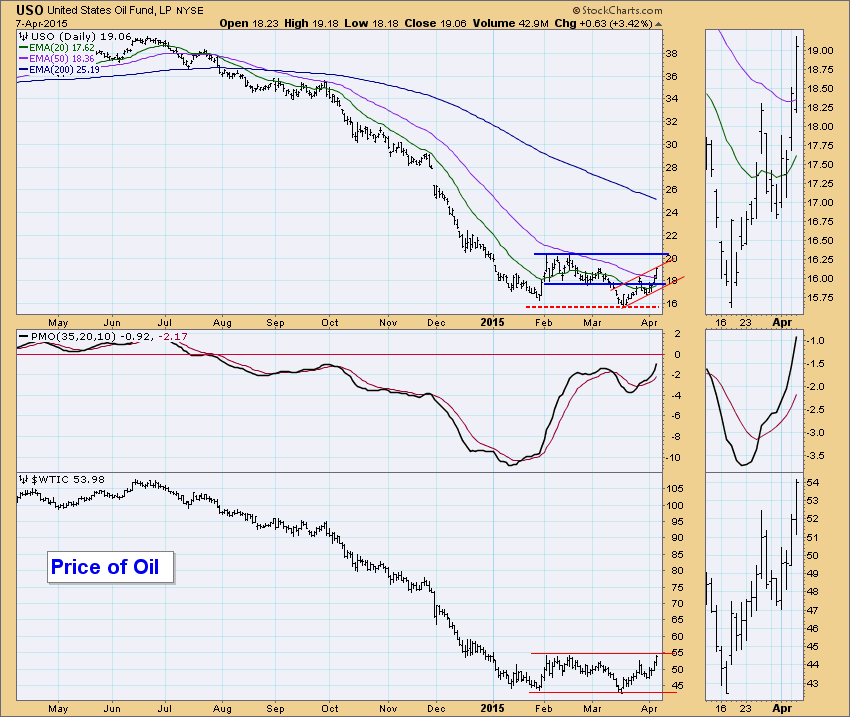
CRUDE OIL (USO): As of 7/30/2014 United States Oil Fund (USO) is on a Trend Model NEUTRAL signal. The LT Trend Model, which informs our long-term outlook, is on a SELL signal as of 8/28/2014, so our long-term posture is bearish.
USO has made a comeback. Price is now in a short-term rising trend channel after it broke back into the training range. PMO is rising very strongly, but is quickly approaching recent overbought territory. I don't like the fact that the price of oil has now reached its overhead resistance, but if it breaks out, that bodes well for USO. The key now is seeing whether it can break out above resistance at the February highs.
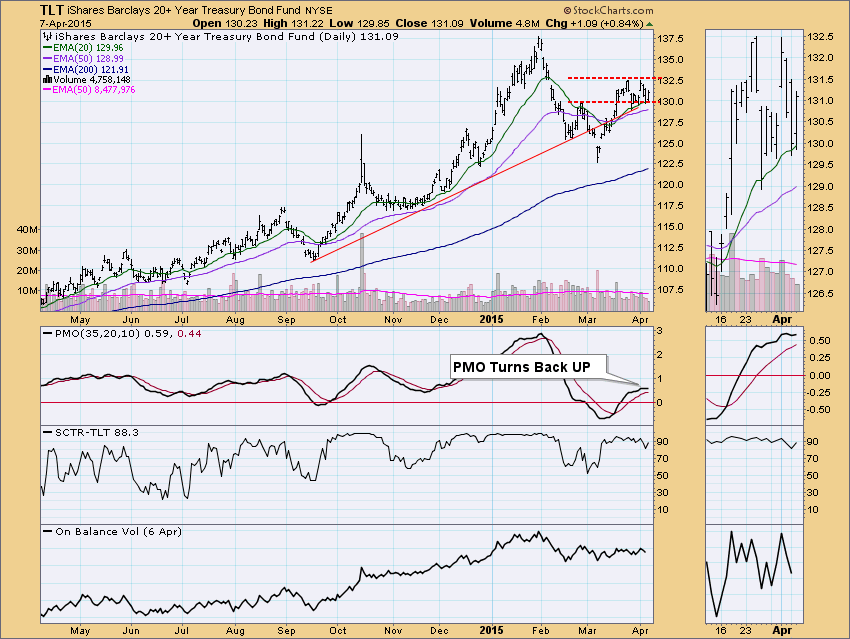
BONDS (TLT): As of 3/19/2015 The 20+ Year T-Bonds ETF (TLT) is on a Trend Model BUY signal. The LT Trend Model, which informs our long-term outlook, is on a BUY signal as of 3/24/2014, so our long-term posture is bullish.
Price has been in a continuation pattern since the end of March. It appeared that a double-top had formed, but it did not execute today, as price bounced off of support. We could still see this pattern execute. Although price bounced off of support, the intraday high didn't break above the declining tops line drawn from the last high. The PMO is flat but did turn up, but not in a convincing way.
Technical Analysis is a windsock, not a crystal ball.
Happy Charting!
- Erin
