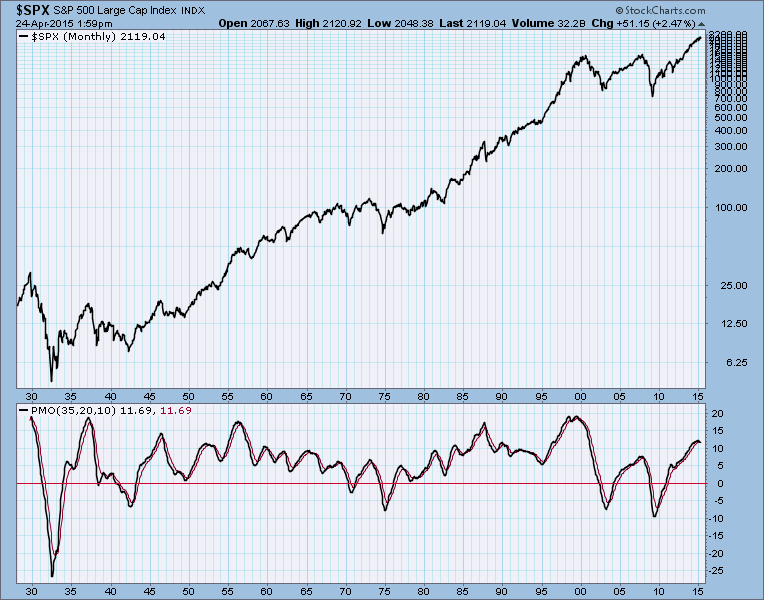
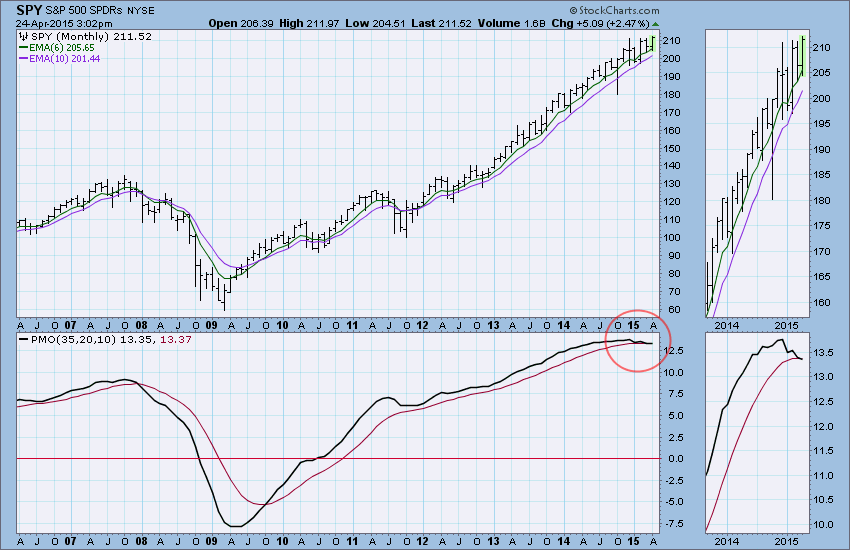
For most of this month we have been watching the monthly PMO (Price Momentum Oscillator) because it topped in December, and in April it crossed below its trigger line, potentially generating a long-term SELL signal. This hasn't happened for over seven years, so it really is kind of a big deal. However, we must remember that monthly charts (and any signals they generate) are not final until the end of the month, which in this case will be Thursday, April 30. Before we draw any conclusions about this, let's take a look at a very long-term chart of the S&P 500 Index and its monthly PMO. (Note: I prefer to use SPY, but it only has about 20 years of data, so for some examples I have to use $SPX.)
The first thing we should notice on this chart is that PMO tops and bottoms generally coincide with important market tops and bottoms. Next, we note the PMO range and estimate overbought and oversold levels. While the PMO is currently modestly overbought, the distance it has traveled since its 2009 low is the second longest bull move on the chart, so in that context it is seriously overbought. A big question is, if the PMO closes the month below its trigger line, how significant is that? Let us show a few close-up examples to help keep this in perspective.
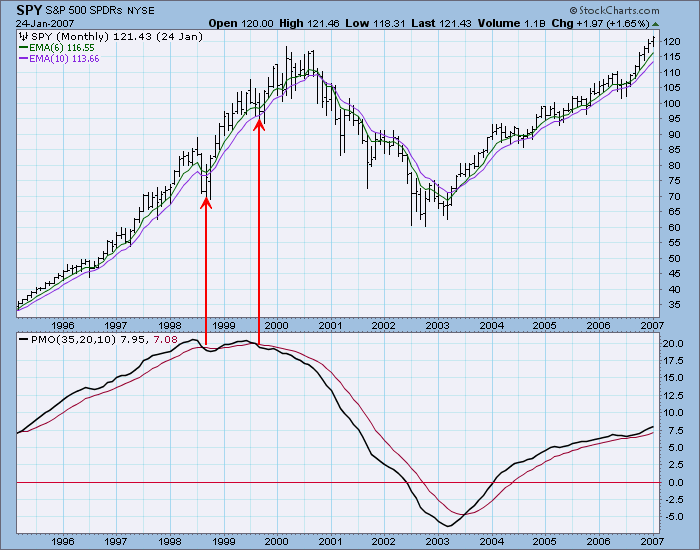
The chart below shows two important market tops: (1) the 1998 top, which led to a -19% correction (bear market); and (2) the major top in 2000, which led to a -50% bear market. The 1998 correction was so rapid that the PMO crossover didn't occur until the price low was in place. However, the PMO crossover associated with the 2000 price top took place in 1999, about six months prior to the completion of the price top, which was a gradual rollover rather than a sharp drop.
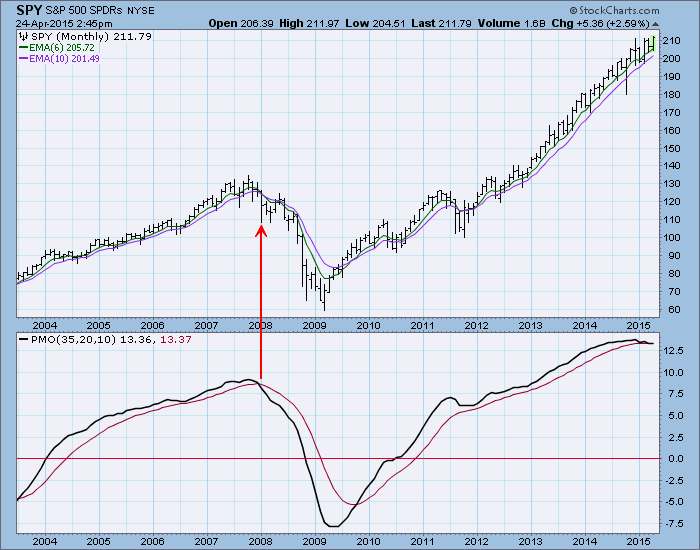
The PMO crossover associated with the 2007 market top took place after the bear market had begun, but the transition was gradual enough that it provided an adequate warning of the troubles ahead.
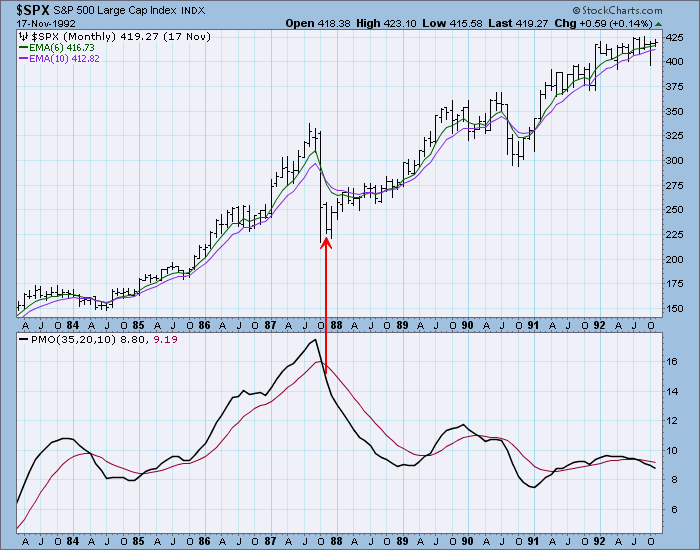
The 1987 Crash gives us another example of a price move that was so extreme that the PMO crossover didn't happen until all the excitement was over.
The current PMO topping and crossover process is definitely a gradual one and is likely to be similar to the one associated with the 2000 market top. This means that, if the monthly PMO downside crossover is official next week, it will still be possible for prices to move higher for a few months. Keep in mind that the PMO is currently reflecting deceleration of upward price movement, not a price top.
Conclusion: The monthly PMO is a slow indicator, but it is good at catching price tops when price rolls over slowly. Conversely, fast market moves will confound this indicator. Whether or not the downside PMO crossover is locked-in next Thursday, its topping action is telling us that the bull market is slowing down, and that there is probably trouble ahead within a matter of a few months.
