Carl always told me that usually when bloggers state a question as the title of their blog, they never end up answering it. I plan on answering the question. We know that technical analysis is not a science, it is an art. Meaning that two people can look at the same chart and many times see different things. I'll show you what I'm seeing and what the DecisionPoint indicators are saying.
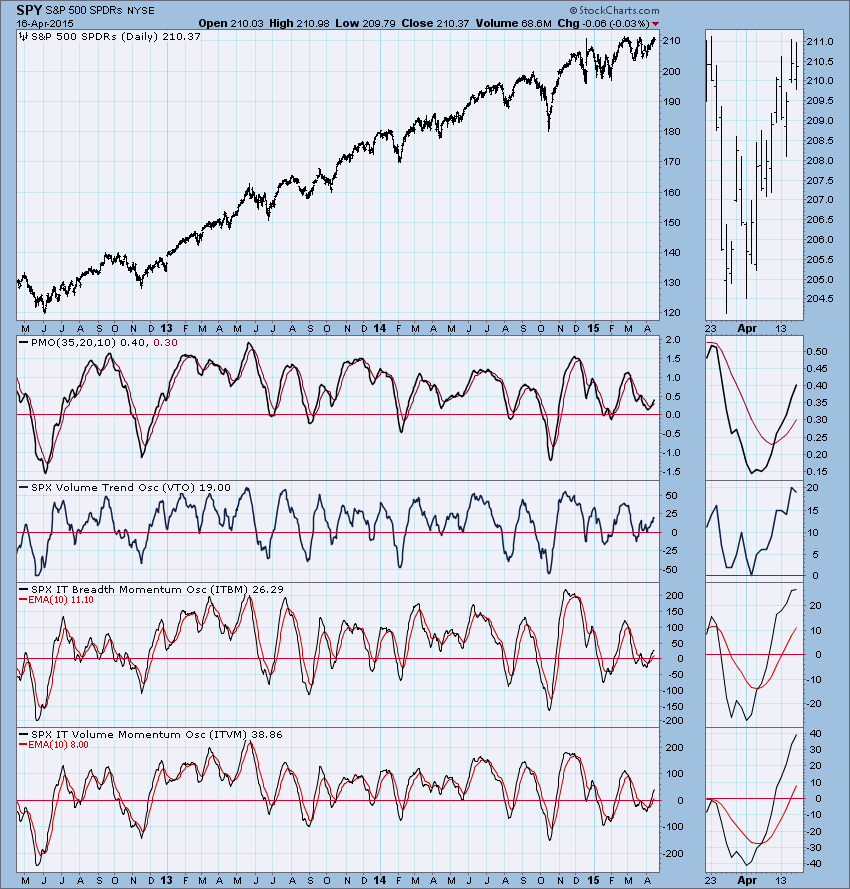
First let's look at the daily chart for the SPY. There are two major chart pattern possibilities here in my opinion. First, is a bullish double (triple)-bottom represented by the purple arrows. The second is as the title suggests, a bearish triple-top. My belief is it is a double (triple)-bottom formation. Here's why. The Price Momentum Oscillator (PMO) is rising and has shown no hesitation in its ride up which is bullish.
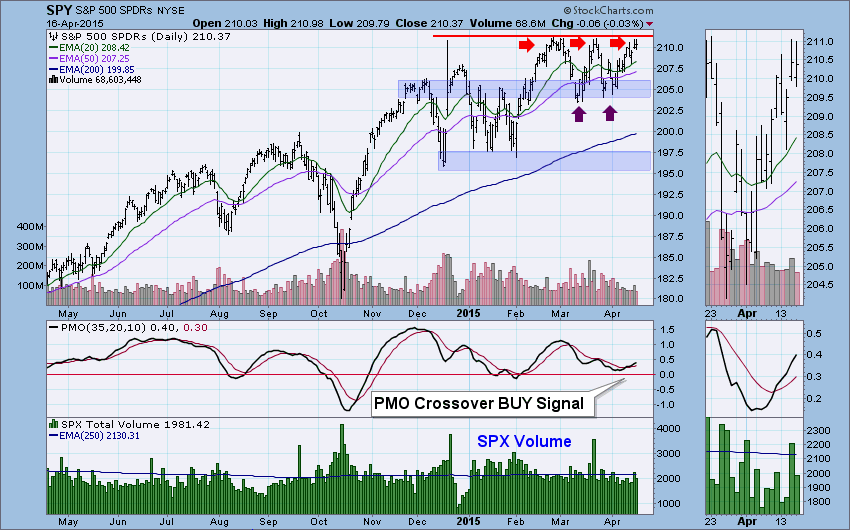
The ultra-short-term price pattern tells us to expect some price decline first. Price is having difficulty penetrating overhead resistance at the all-time price highs. The pattern could loosely be considered a bearish double-top. Good news it isn't that wide and ultra-short-term support is around 208.
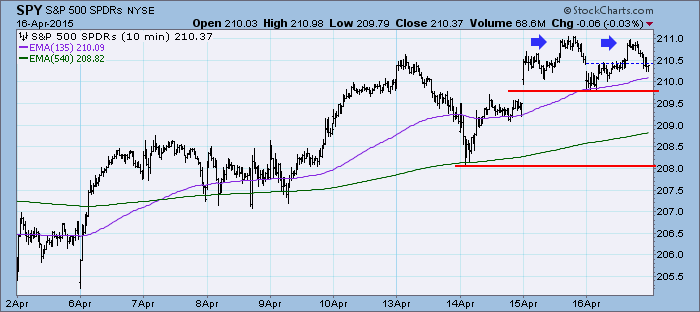
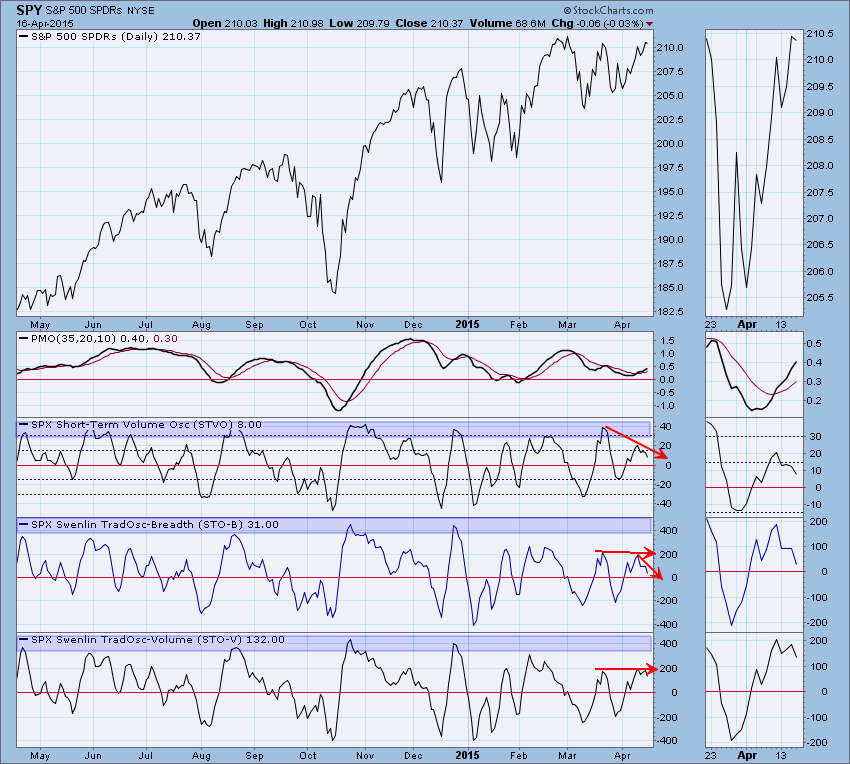
Next, ultra-short-term indicators show negative divergences with the recent price rise off of support. This suggests a very near-term price decline (or consolidation).
Short-term indicators aren't looking much better with their own negative divergences. They are at least reading above zero which is somewhat positive even though they are mainly in decline.
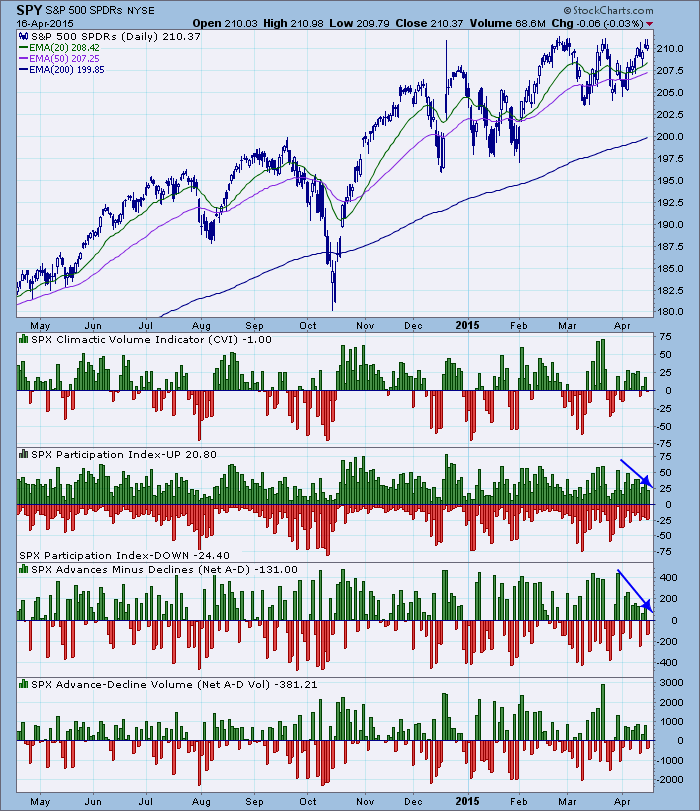
Intermediate-term indicators are rising out of a positive crossover which is positive. They room to move higher without becoming overbought which is also positive in the intermediate-term.
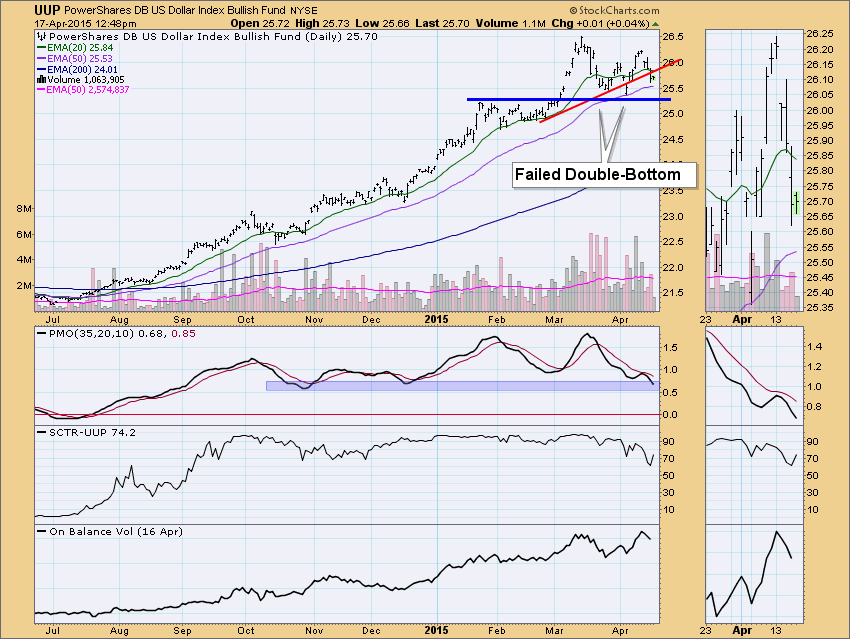
A weakening dollar is also good news for the market. Looking at the chart for UUP, that weakening is clearly visible. The aborted double-bottom pattern is the most telling, followed by a breakdown from the short-term rising bottoms trend line. The SCTR value is falling and the PMO bottomed below its EMA which is also a very bearish sign. Support is very near but I'm not so sure it will hold this time around.
Regardless of whether it turns out to be a double-bottom or triple-bottom, price has not confirmed either right now. We are dependent on the indicators to persuade us. In the ultra-short and short-term, indicators suggest there will be more consolidation or a short price decline. The market will need some internal strength to breakout and the PMO indicates there is at least some internal strength. Intermediate-term indicators imply a bullish result from a double-bottom. The dollar is weakening and its price pattern doesn't look promising which is bullish for equities. So...the answer to the title question based on the indicators is "No".
Happy Charting!
Erin
