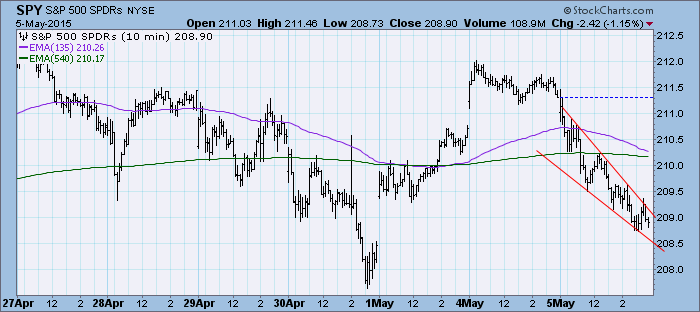
Price snapped back toward the Friday low today. It appeared at the end of the day it might break out from the descending wedge. It's a bullish formation so that is the expectation. A wedge tells us the direction to expect a move. Unfortunately, it doesn't tells us when or how long/large the move will be, but remember, this is a 10-minute bar chart, so we are talking ultra-short term..
The purpose of the DecisionPoint Daily Update is to quickly review the day's action, internal condition, and Trend Model status of the broad market (S&P 500), the nine SPDR Sectors, the U.S. Dollar, Gold, Crude Oil, and Bonds. To ensure that using this daily reference will be quick and painless, we are as brief as possible, and often we let a chart speak for itself.
SIGNALS: Here we include the current day's signal table, an excerpt from the DecisionPoint Alert Daily Report.
DECISIONPOINT ALERT DAILY REPORT
Tuesday, 5/5/2015

************************ DECISIONPOINT MARKET POSTURE *************************************

The following is the market posture suggested by our mechanical trend-
following tools. These are not trading recommendations, rather they are price
activity flags that should be qualified by chart analysis. The Trend Model is
used on all indexes.


                                     Days   Index     05/05   Points  Percent   Prev Signal
Index               Posture     Date Elap  @Start     Close      P/L      P/L     P/L  Days
------------------- ------- -------- ---- -------   -------  -------  ------- ------- -----
Stocks Medium-Term  Bullish 10/31/14  186   199.66   208.90    +9.24    +4.6%
Stocks Long-Term    Bullish 10/31/14  186   199.66   208.90    +9.24    +4.6%
Gold (NY Spot)      Bearish 02/23/15   71  1200.80  1193.20    +7.60    +0.6%
20+Yr T-Bond  (TLT) Neutral 04/29/15    6   125.47   122.66     ....     ....
------------------- ------- -------- ---- -------   -------  -------  ------- ------- -----
Dollar Index  (UUP) Neutral 05/05/15    0    25.03    25.03 * Changed Today *  +16.6%   288
Commodities   (GSG) Bullish 04/24/15   11    21.17    21.90    +0.73    +3.4%
Crude Oil     (USO) Bullish 04/21/15   14    19.45    20.76    +1.31    +6.7%
------------------- ------- -------- ---- -------   -------  -------  ------- ------- -----
S&P 500       (SPY)     BUY 10/31/14  186   199.66   208.90    +9.24    +4.6%
S&P Equal Wt  (RSP)     BUY 11/03/14  183    77.46    81.49    +4.03    +5.2%
Dow           (DIA)     BUY 02/03/15   91   175.43   179.01    +3.58    +2.0%
Nasdaq 100    (QQQ)     BUY 10/29/14  188    99.21   107.45    +8.24    +8.3%
NDX Equal Wt (QQEW)     BUY 10/30/14  187    40.47    44.15    +3.68    +9.1%
S&P 100       (OEF)     BUY 02/04/15   90    89.49    92.01    +2.52    +2.8%
S&P 400 MidCp (IJH)     BUY 11/05/14  181   140.67   149.72    +9.05    +6.4%
S&P 600 SmlCp (IJR)     BUY 11/03/14  183   110.56   115.08    +4.52    +4.1%
Total Market  (VTI)     BUY 11/03/14  183   103.05   107.98    +4.93    +4.8%
Consumer Disc (XLY)     BUY 11/05/14  181    67.05    75.71    +8.66   +12.9%
Cons Disc EWt (RCD)     BUY 11/03/14  183    82.41    90.42    +8.01    +9.7%
Consumer Stpl (XLP)     BUY 08/20/14  258    44.00    48.49    +4.49   +10.2%
Cons Stpl EWt (RHS)     BUY 10/21/14  196    97.26   107.15    +9.89   +10.2%
Energy        (XLE)     BUY 04/09/15   26    79.79    81.64    +1.85    +2.3%
Energy EWt    (RYE)     BUY 04/09/15   26    69.34    72.14    +2.80    +4.0%
Financial     (XLF)     BUY 02/13/15   81    24.34    24.36    +0.02    +0.1%
Financial EWt (RYF)     BUY 02/05/15   89    44.13    44.32    +0.19    +0.4%
Health Care   (XLV)     BUY 10/23/14  194    63.89    72.22    +8.33   +13.0%
Health Cr EWt (RYH)     BUY 05/09/14  361   115.73   153.46   +37.73   +32.6%
Industrial    (XLI) Neutral 05/05/15    0    55.66    55.66 * Changed Today *   -1.5%    21
Industrl EWt  (RGI)     BUY 02/09/15   85    88.54    89.05    +0.51    +0.6%
Materials     (XLB)     BUY 04/15/15   20    50.19    50.53    +0.34    +0.7%
Materials EWt (RTM)     BUY 04/10/15   25    86.75    89.02    +2.27    +2.6%
Technology    (XLK)     BUY 02/09/15   85    40.87    42.47    +1.60    +3.9%
Technolgy EWt (RYT)     BUY 02/05/15   89    89.42    92.63    +3.21    +3.6%
Utilities     (XLU) Neutral 02/20/15   74    45.33    43.80     ....     ....
Utilities EWt (RYU) Neutral 02/25/15   69    75.94    73.70     ....     ....

Average                               130                               +6.4%
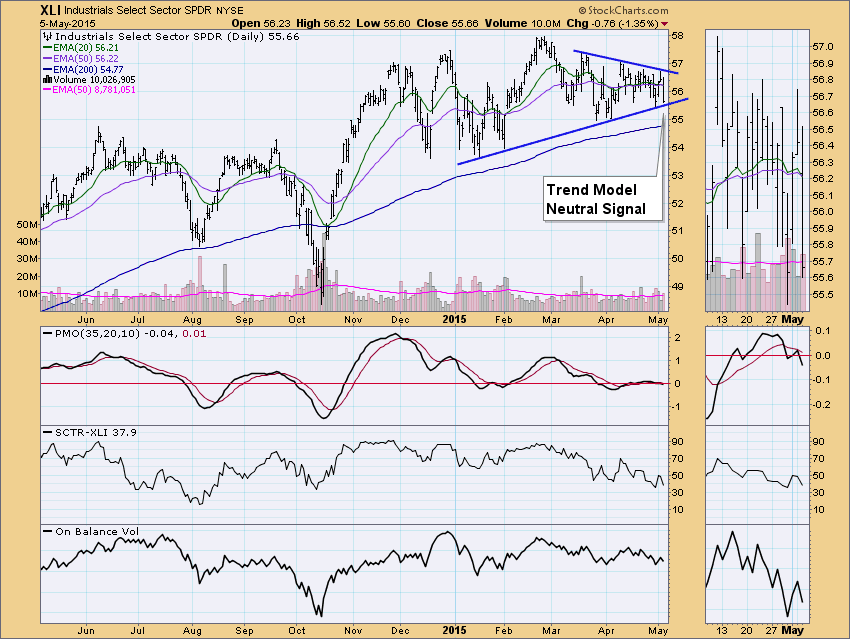
There was a signal change on UUP and the Industrial ETF (XLI). I'll talk about UUP in the section below on the Dollar. Looking at XLI, we see that the Neutral signal was generated on the Trend Model when the 20-EMA crossed below the 50-EMA. Because the 50-EMA was above the 200-EMA, we assume XLI is in a longer-term bull market, consequently our signal is Neutral (Cash/Fully Hedged) rather than a SELL signal (a shorting opportunity). We can see that XLI has been experiencing whipsaw because the 20/50-EMA are traveling close together and price has narrowed within the medium-term symmetrical triangle. The PMO had a negative crossover its signal line last week, so the new Trend Model signal confirms bearish implications of the PMO SELL signal.
NOTE: Mechanical trading model signals define the implied bias of the price index based upon moving average relationships, but they do not necessarily call for a specific action. They are information flags that should prompt chart review. Further, they do not call for continuous buying or selling during the life of the signal. For example, a BUY signal will probably return the best results if action is taken soon after the signal is generated. Additional opportunities for buying may be found as price zigzags higher, but the trader must look for optimum entry points. Conversely, exit points to preserve gains (or minimize losses) may be evident before the model mechanically closes the signal.
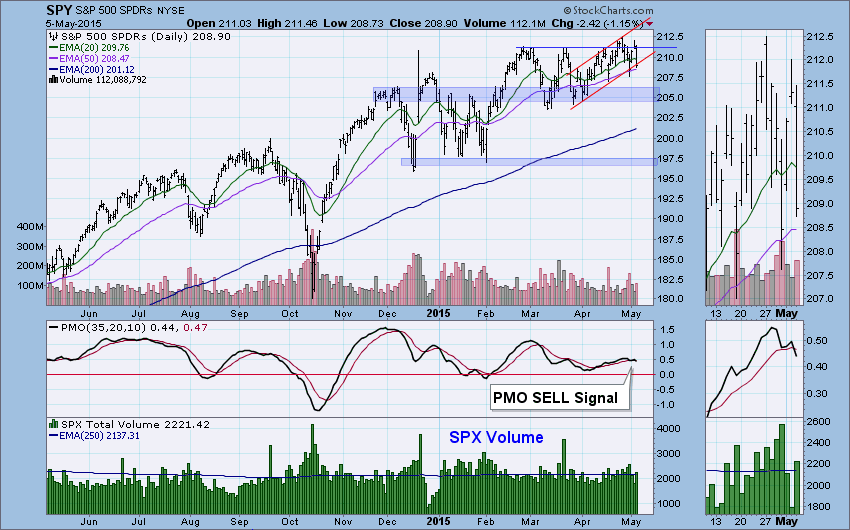
STOCKS: Based upon a 10/31/2014 Trend Model BUY signal, our current intermediate-term market posture for the S&P 500 (SPY) is bullish. The Trend Model, which informs our long-term outlook, is on a BUY signal as of 10/31/2014 so our long-term posture is bullish.
We've been watching a bullish descending triangle for some time, but price has traveled too far into the apex for me to have confidence in the pattern. Instead I've annotated a shorter-term rising trend channel which I believe is valid even after today's large decline. Technically if you are still a fan of the triangle, price has had two small breakout moves that didn't pan out but it is above the rising bottoms line that defines the bottom of the descending triangle. The PMO had a negative crossover today in mostly neutral territory which could be a problem. Volume was above average on today's decline which is somewhat bearish.
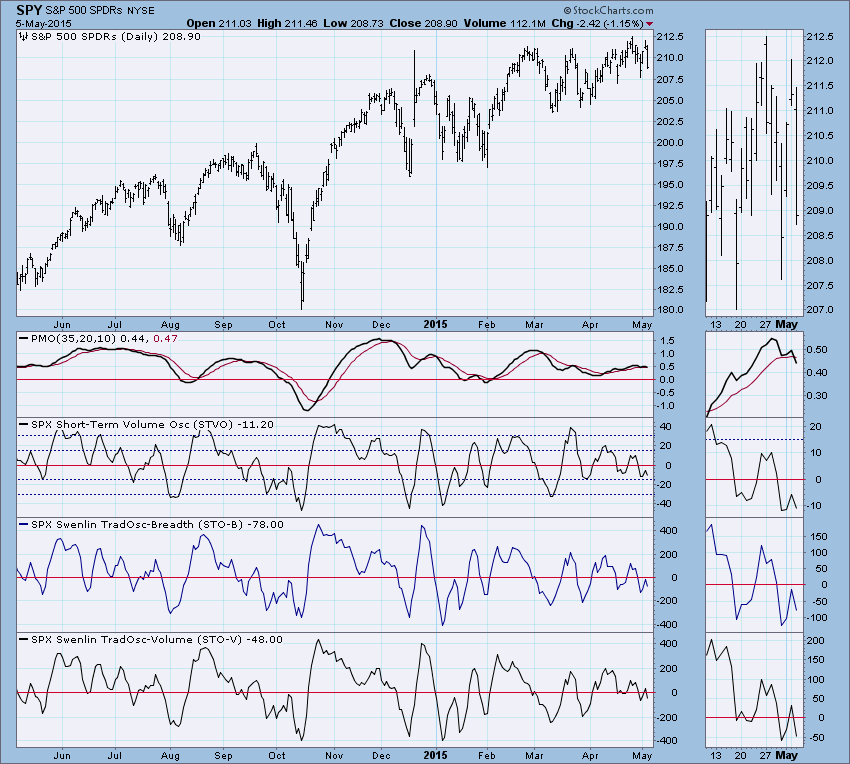
Ultra-Short-Term Indicators: I wrote my ChartWatchers article on this chart last Sunday which I encourage you to read for further analysis on ultra-short-term indicators. Today some of the readings were elevated, but not enough to consider them climactic. Thursday saw some climactic activity (the arrows on the chart) which was an ultra-short-term exhaustion climax.
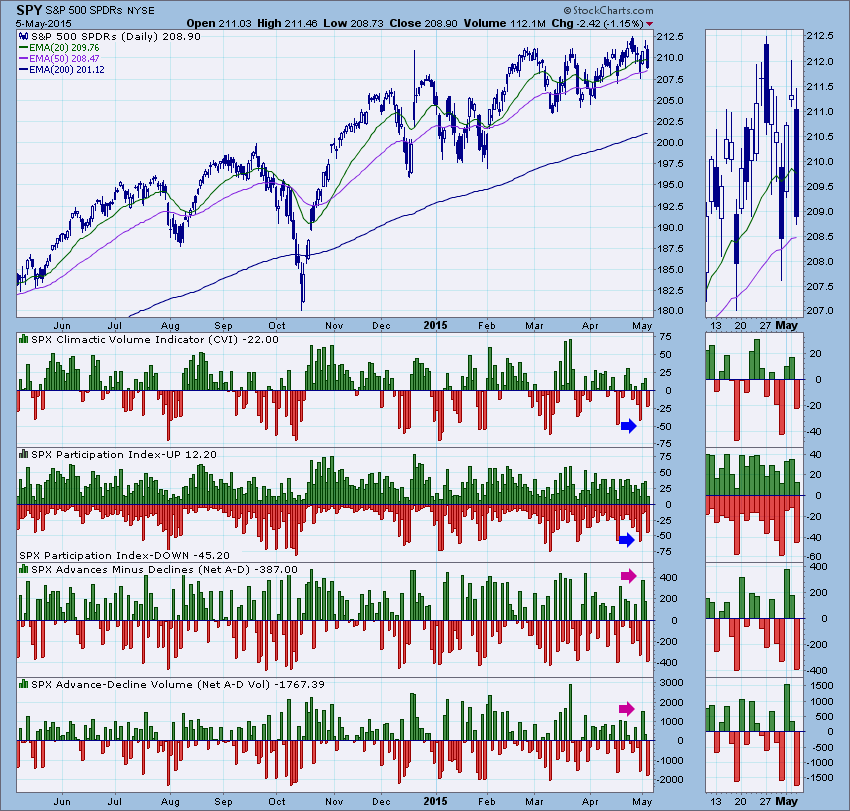
Short-Term Indicators: These indicators are technically bearish in that they are declining. However, they are very twitchy right now and oscillating carefully around the zero line which is more neutral rather than bullish/bearish.
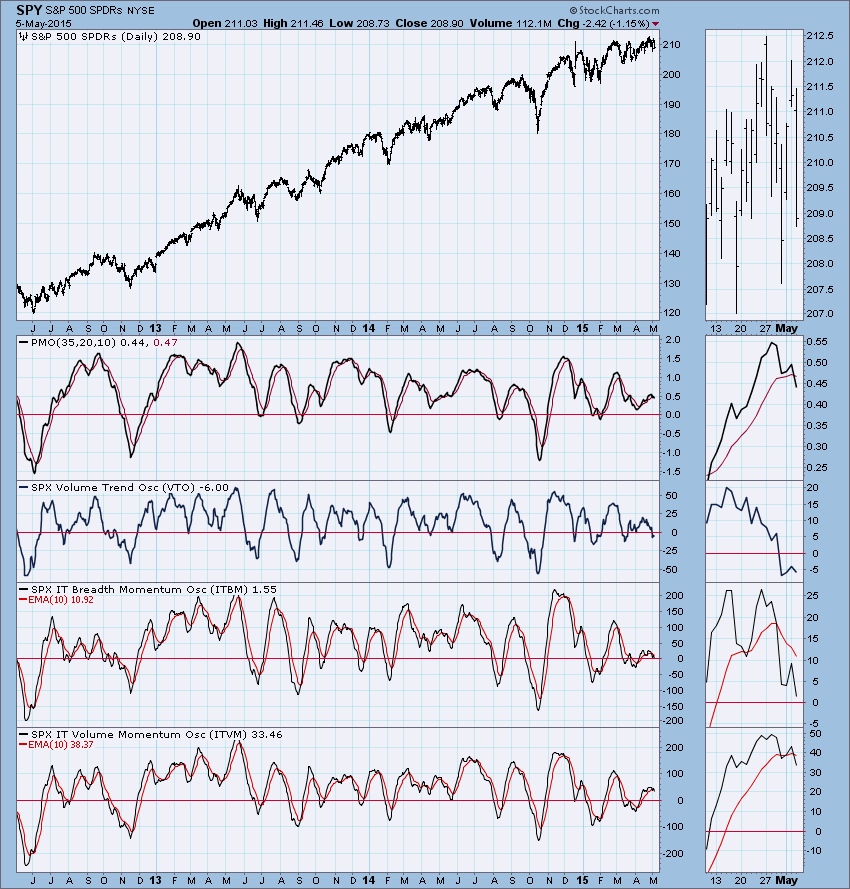
Intermediate-Term Indicators: These indicators are having issues with narrowing like the short-term indicators above but they are more bearish than neutral because the readings are moving lower below their signal line. The ITBM topped below its EMA which is distinctly bearish.
Conclusion: The market is struggling mightily to have a decisive breakout above all-time highs. So far it is only managing to get its foot in the door but then ends up getting pushed back down. The descending triangle is exhausting itself as price nears the apex without a significant breakout in one direction or the other. Price is moving in a shorter-term rising trend channel which is positive. Ultra-short-term indicators have supported the bulls, but current readings are not clear and therefore more neutral than bullish. Short-term indicators are somewhat bearish, but looking at their movement, I'd place them in the neutral category until readings spread out. Intermediate-term indicators are negative. Let's not forget that we had a monthly PMO negative crossover SELL signal at the end of April. In the very short term, the bullish rising trend channel looks good, but the intermediate term is neutral to bearish.
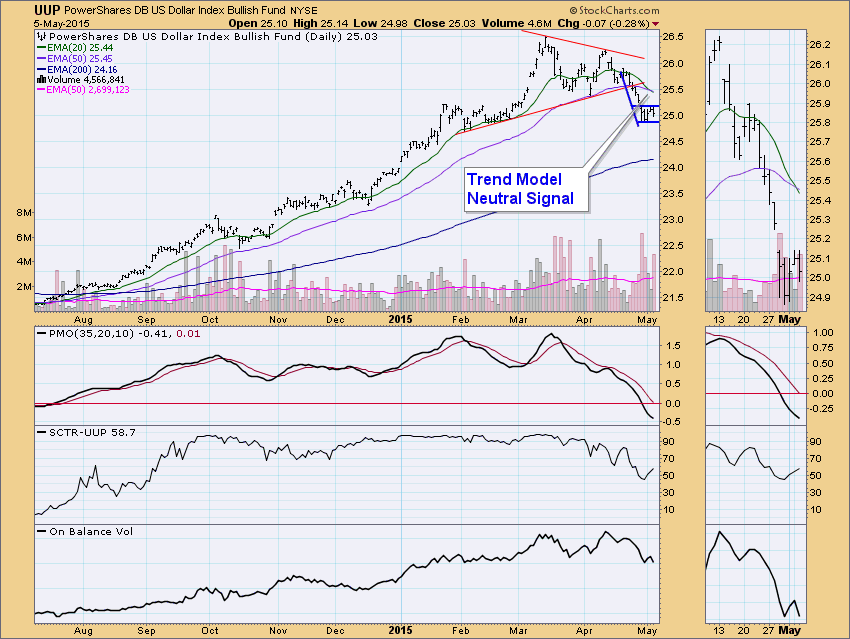
DOLLAR: As of 5/5//2015 the US Dollar Index ETF (UUP) is on a Trend Model BUY signal. The LT Trend Model, which informs our long-term outlook, is on a BUY signal as of 8/21/2014, so our long-term posture is bullish.
The dollar has shown weakness since mid-March. Shortly thereafter, a PMO negative crossover SELL signal generated. Today the slower Trend Model confirmed that signal as it generated a Neutral signal after the 20-EMA crossed below the 50-EMA while the 50-EMA was above the 200-EMA. There is a very clear reverse flag formation. This is a bearish pattern that will execute when price breaks below the top of the flag. Once executed, the expected downside target is the length of the pattern added to the top of the flag. The minimum downside target would be around 24.10.
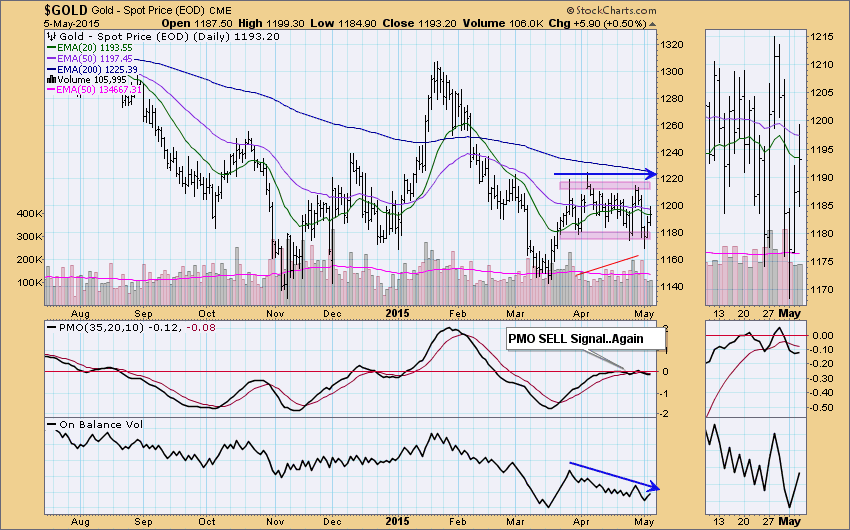
GOLD: As of 2/23/2015 Gold is on a Trend Model SELL signal. The LT Trend Model, which informs our long-term outlook, is on a SELL signal as of 2/15/2013, so our long-term posture is bearish.
Gold continues to wander within a consolidation channel. The weakness in the dollar should begin to translate to added strength for gold, but the price pattern suggests we aren't there yet. There was a PMO SELL signal last week. Readings remained mostly below zero since February which is bearish. When the PMO turns down below the zero line or its signal line that is very bearish. I've annotated a negative divergence between volume and price.
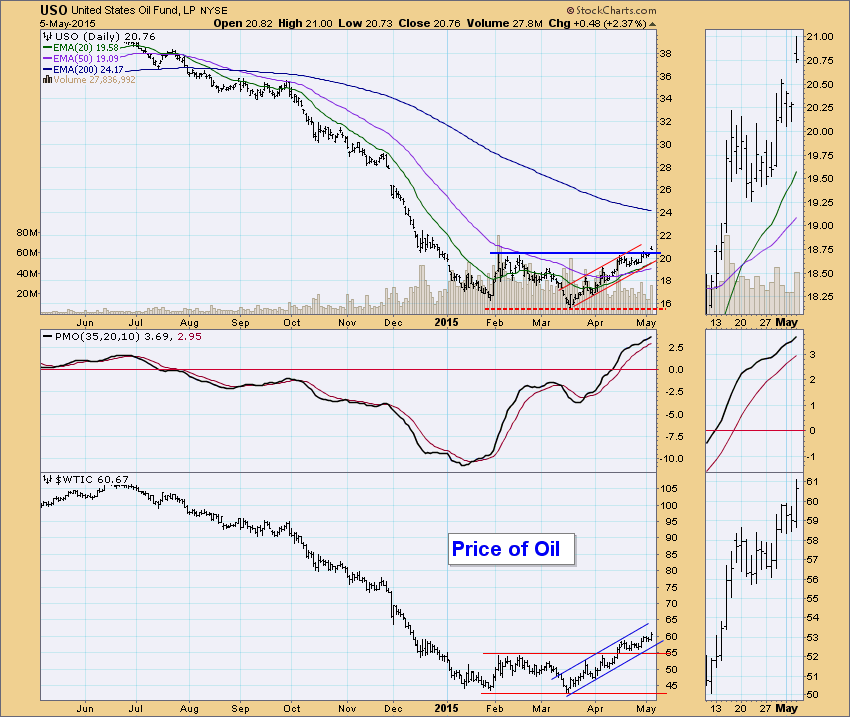
CRUDE OIL (USO): As of 4/21/2015 United States Oil Fund (USO) is on a Trend Model BUY signal. The LT Trend Model, which informs our long-term outlook, is on a SELL signal as of 8/28/2014, so our long-term posture is bearish.
USO finally broke out above resistance with a gap up. The thumbnail looks great. USO has executed a bull flag and based on the length (bottom of pole to top of flag), the minimum upside target is around $22. Oil has also executed a flag and the minimum upside target is around $67.
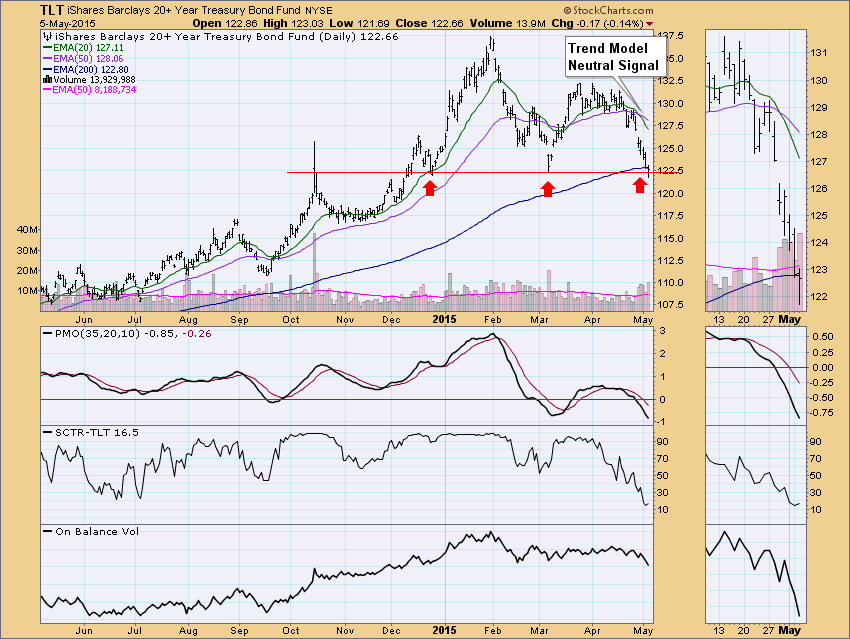
BONDS (TLT): As of 5/5/2015 The 20+ Year T-Bonds ETF (TLT) is on a Trend Model Neutral signal. The LT Trend Model, which informs our long-term outlook, is on a BUY signal as of 3/24/2014, so our long-term posture is bullish.
Price fell out of its area of consolidation with a breakaway gap. It has now reached important support and it appears it will break down below it. The importance of this support line is indicated by the three arrows that show how it has been tested. It also coincides with resistance near the October high. Despite previous successful support tests, given the PMO SELL signal and confirming Trend Model Neutral signal, I think the Magic 8-Ball forecast would be "outlook not so good".
Technical Analysis is a windsock, not a crystal ball.
Happy Charting!
- Erin
