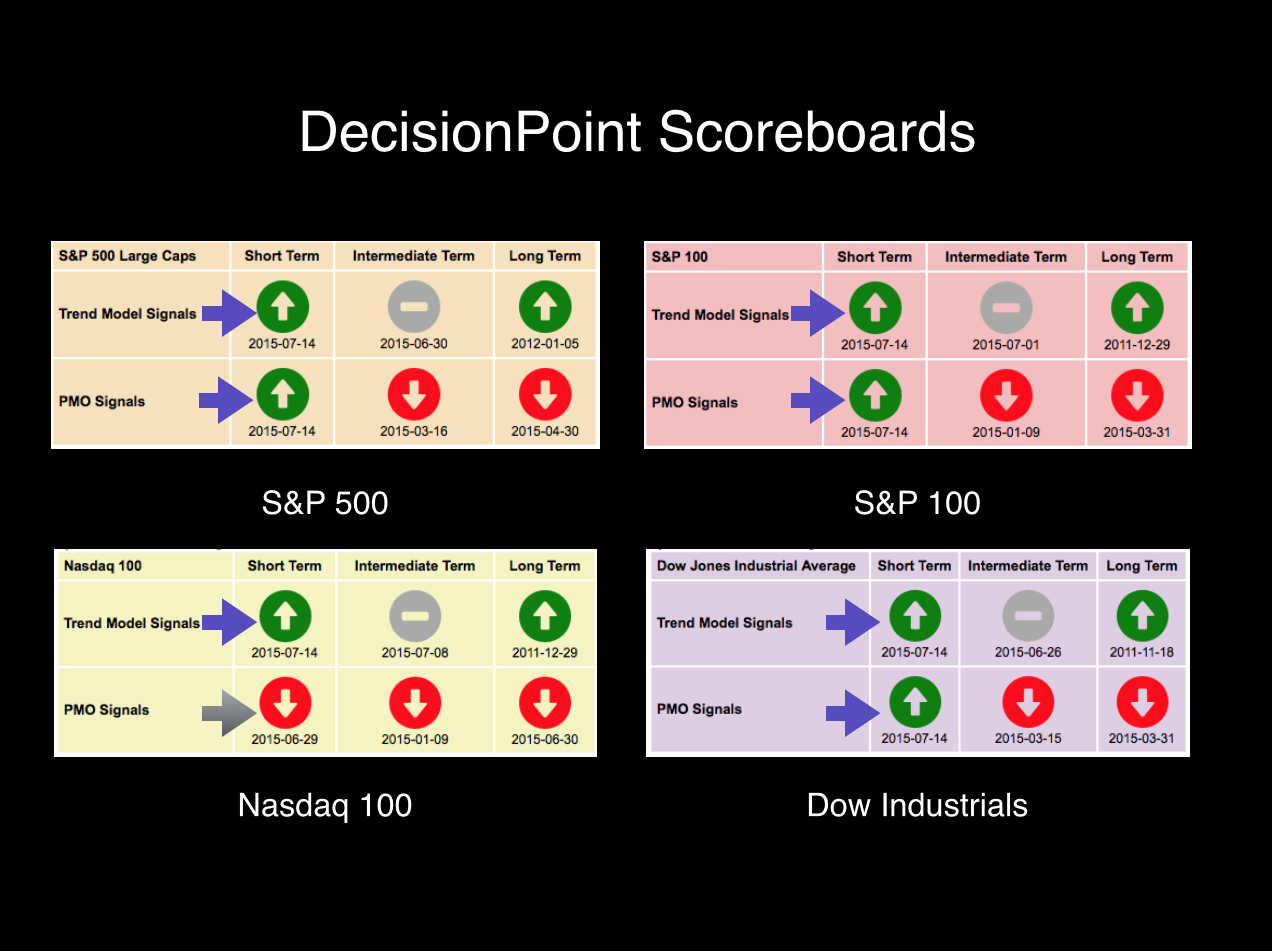
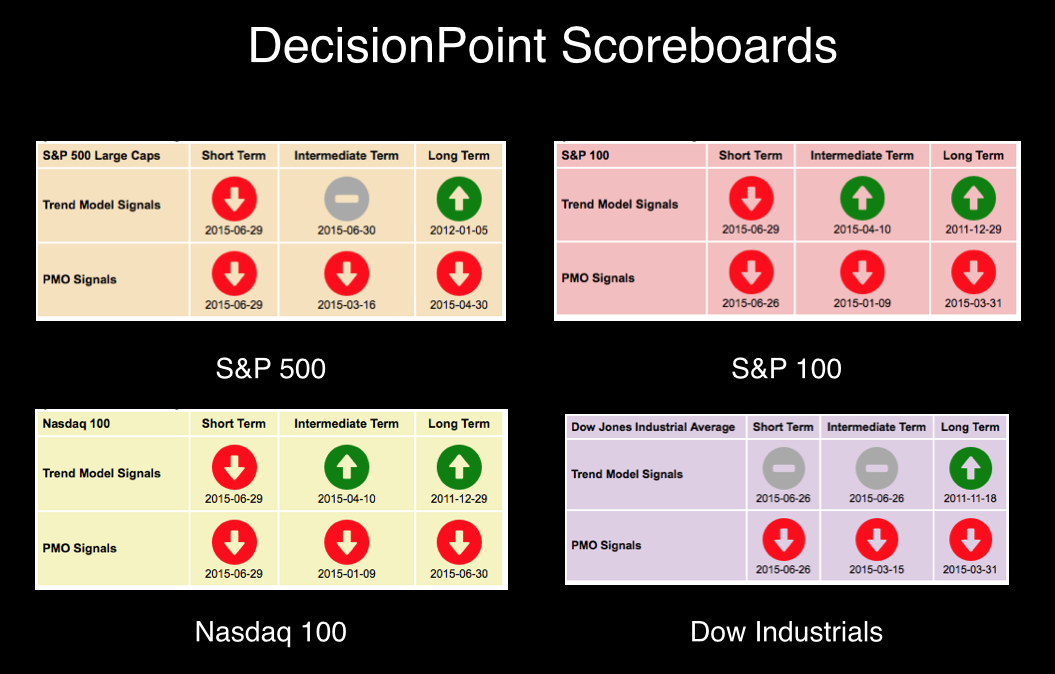
DecisionPoint July 30, 2015 at 07:03 PM

If you check out the DP Chart Gallery Scoreboards, you'll see that the picture for the Dow Industrials is bearish while the other indexes (SPX, NDX and OEX) are looking much more bullish... Read More
DecisionPoint July 28, 2015 at 08:17 PM

I recently received an email from one our DecisionPoint veterans who followed us in our early years. He asked about the Thrust/Trend Model (T/TM) which we used to employ instead of the Trend Model to determine our timing signals. Before we moved to StockCharts... Read More
DecisionPoint July 26, 2015 at 12:01 AM
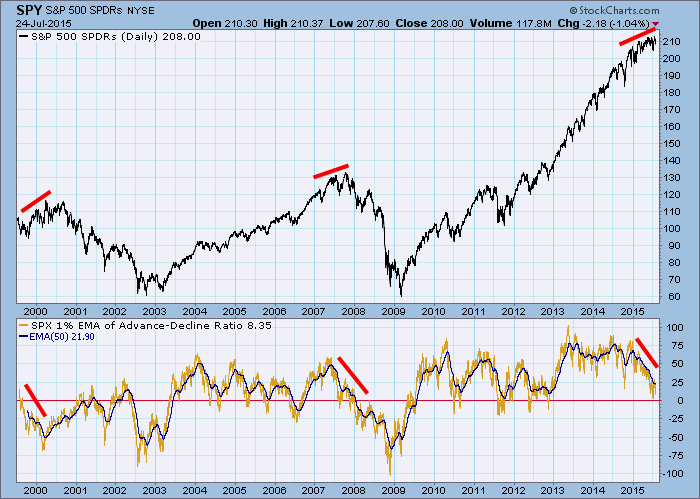
The price index on the chart below has continued to edge higher, but we can see that pattern is becoming congested. The lower panel shows the 1% EMA of the Advance-Decline Ratio* and its 50EMA. The daily data is pretty volatile, so the 50EMA is easier to interpret... Read More
DecisionPoint July 23, 2015 at 07:12 PM
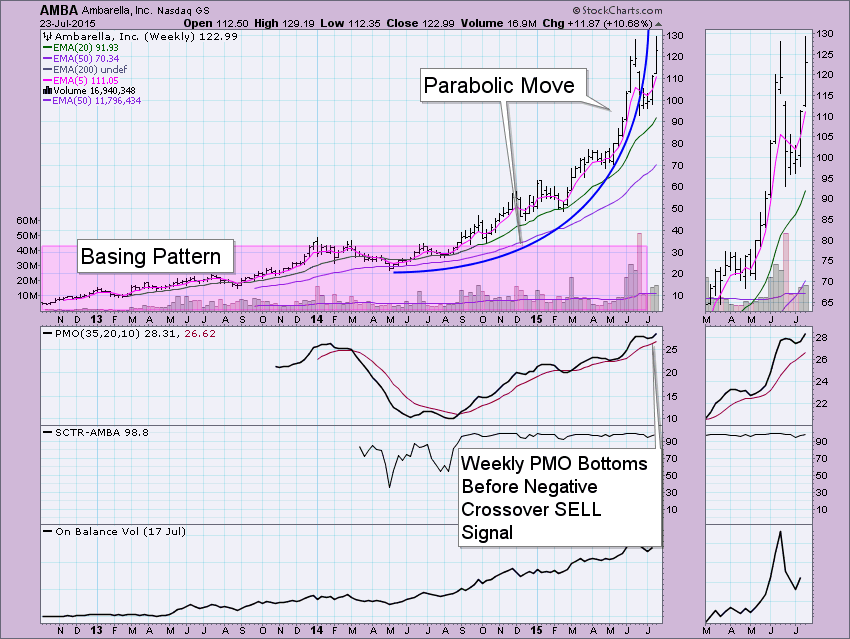
My obsession with this stock has not abated. It was one of the more "fun" stocks I've owned in a long time, so I keep revisiting it... Read More
DecisionPoint July 20, 2015 at 07:41 PM
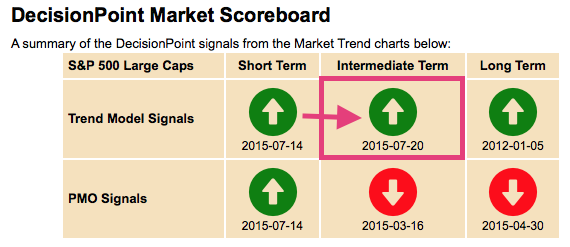
It's nice to be back from vacation (if you call driving your daughter from Auburn, AL to California with a trailer attached to a small compact car in three days, a vacation) and see the market begin to make all-time highs again... Read More
DecisionPoint July 18, 2015 at 10:45 PM
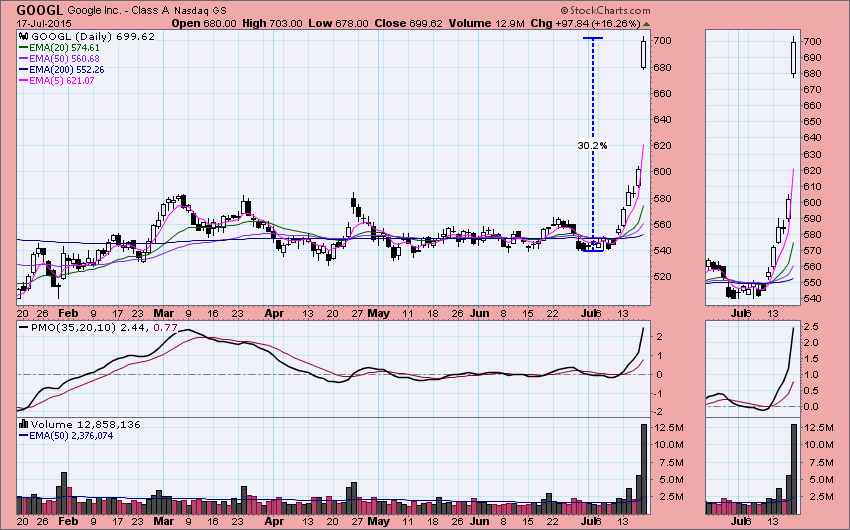
Friday was a big day for Google (GOOG and GOOGL) with both the class "A" and class "C" stock up over +16% on earnings news. Actually, so far July has been a big month with GOOGL and GOOG being up about +30% since the July 7 low... Read More
DecisionPoint July 16, 2015 at 02:08 PM

Webinar Question: Does a reversal in the daily PMO (Price Momentum Oscillator) have any effect on the PMO on weekly and monthly charts? Carl's Answer: PMOs for the daily, weekly, and monthly time frames, while calculated with the same formula, are essentially different indicators... Read More
DecisionPoint July 14, 2015 at 07:57 PM
I will admit to you that when I get the Technical Alert emails from the StockCharts.com ScanEngine regarding changes for all of the DP Sector ETFs and Indexes we follow in the DP Market/Sector Summary, I cringe a little... Read More
DecisionPoint July 12, 2015 at 11:53 AM
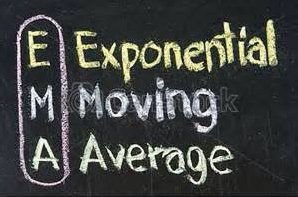
QUESTION: In the StockCharts DecisionPoint documentation, it says that the weekly (17EMA and 43EMA) and monthly charts (6EMA and 10EMA) can be used to show long-term trends, but in the webinar, Erin said that they use only the daily chart... Read More
DecisionPoint July 09, 2015 at 07:19 PM

As I perused the DecisionPoint Market/Sector Summary found in the DP Reports blog, I noticed that there are still some very old Intermediate-Term Trend Model (ITTM) BUY signals... Read More
DecisionPoint July 08, 2015 at 12:45 AM
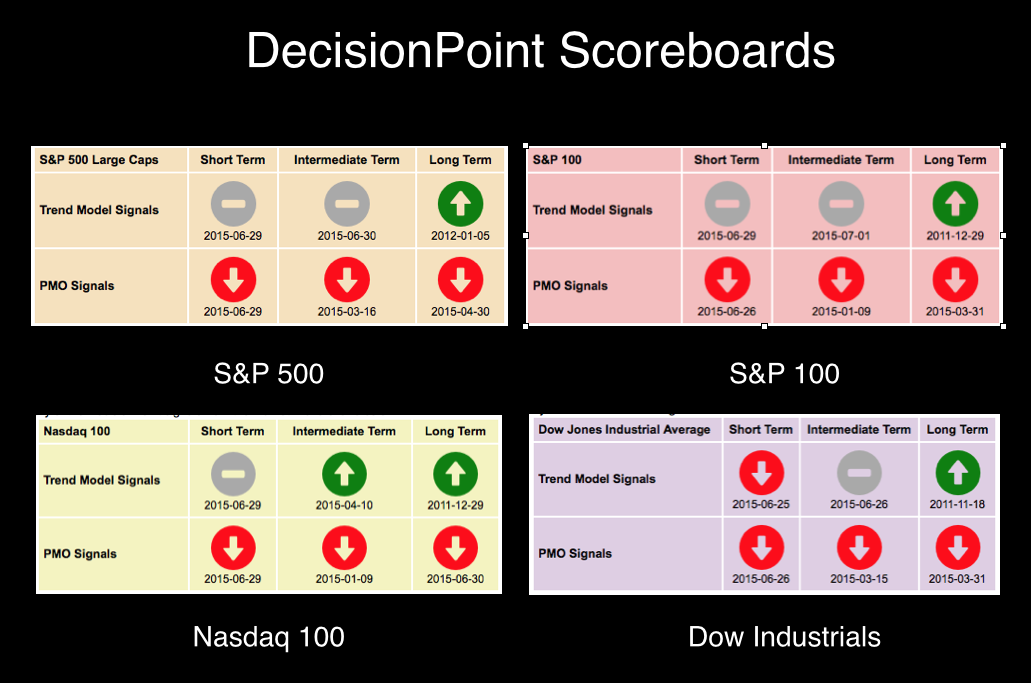
The DecisionPoint Scoreboard, located in the DP Chart Gallery, has been slowly flipping signals. Similarly we have seen a flip of Intermediate-Term Trend Model (ITTM) signals to Neutral or SELL... Read More
DecisionPoint July 04, 2015 at 08:44 PM
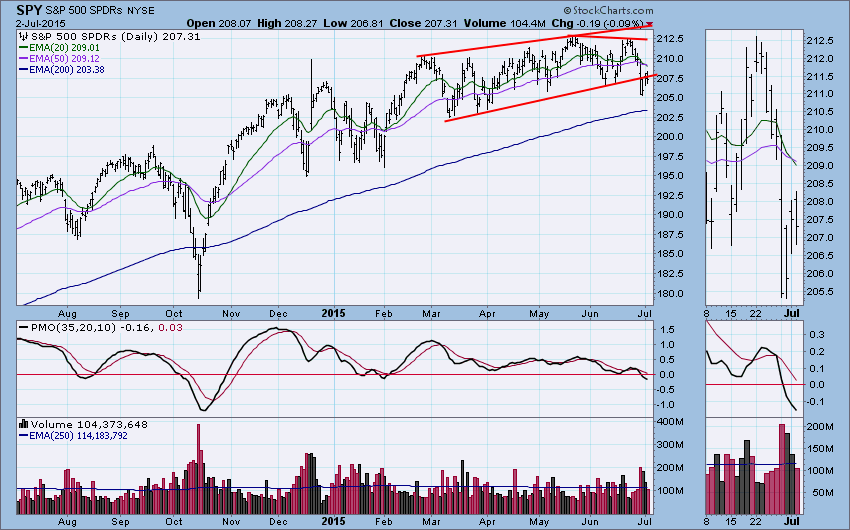
On Thursday the DP Trend Model for SPY changed from BUY (long the market) to NEUTRAL (in cash or fully hedged) when the 20EMA crossed down through the 50EMA... Read More
DecisionPoint June 30, 2015 at 09:50 PM
There were two important signal changes in the DP Scoreboards in the DecisionPoint Chart Gallery. The NDX finally submitted to a long-term Price Momentum Oscillator (PMO) SELL signal. The other three in the gallery were already on long-term PMO SELL signals... Read More