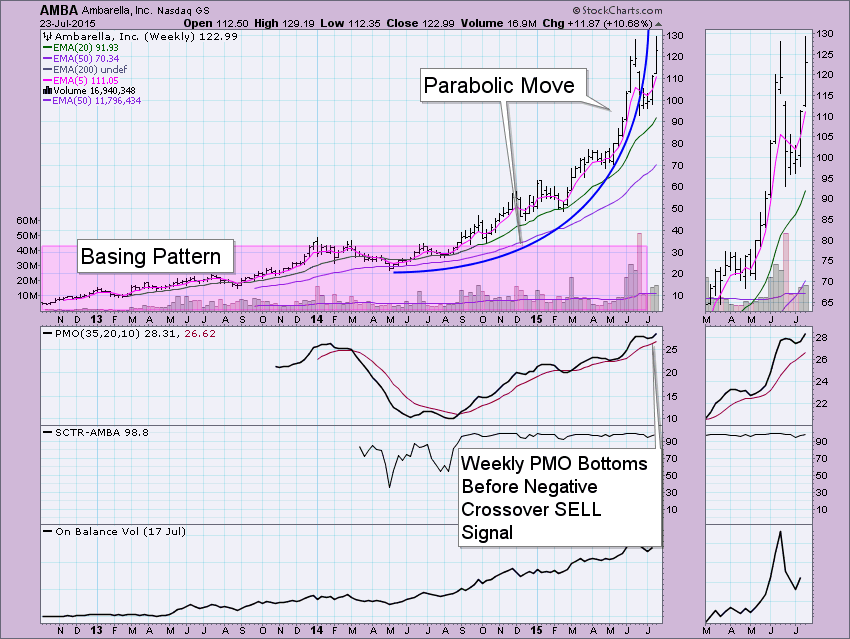
My obsession with this stock has not abated. It was one of the more "fun" stocks I've owned in a long time, so I keep revisiting it. After having ridden the parabolic move higher, I, like many, was wiping my brow and letting out a long exhale of relief when my stop triggered on the day it crashed. Below is a weekly chart that illustrates the parabolic move and the subsequent breakdown. The expectation of a parabolic pattern is a correction that will take you to the basing pattern or area where price had previously been maintaining. Instead of crashing to the base price around 30 or even 60, price turned back around and today closed at an all-time high.
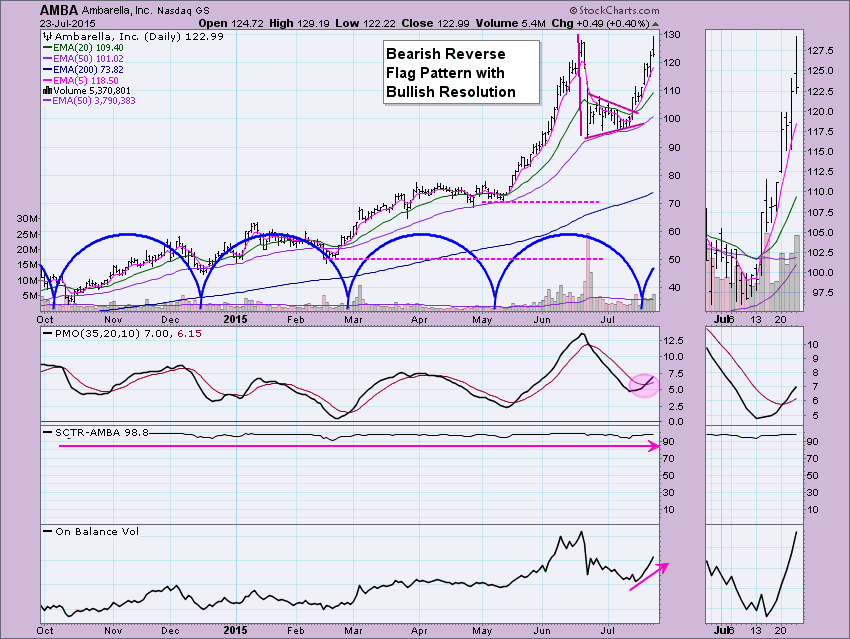
The daily chart shows the reverse flag formation and subsequent breakout rally. Whenever a bearish pattern has a bullish resolution, I deem it especially bullish. Note also, the near precise cyclical nature of price movement over the past year. The SCTR hasn't even twitched from A+ territory and now the On Balance Volume (OBV) is supporting the veracity of the recent rally. The Price Momentum Oscillator (PMO) generated a BUY signal earlier this week and I note that the Intermediate-Term Trend Model (ITTM) has remained on a BUY signal even after the corrective move.
I'm personally not interested in jumping back in. Price just set an all-time high in an area that many "experts" were saying was ridiculously overpriced. The P/E ratio is over 64 right now. However, cycle study, the PMO BUY signal and a recent Short-Term Trend Model BUY signal suggest there is more upside potential. The parabola might just be reshaping, so tread carefully.
Technical Analysis is a windsock, not a crystal ball.
Happy Charting!
- Erin
