 Webinar Question: Does a reversal in the daily PMO (Price Momentum Oscillator) have any effect on the PMO on weekly and monthly charts?
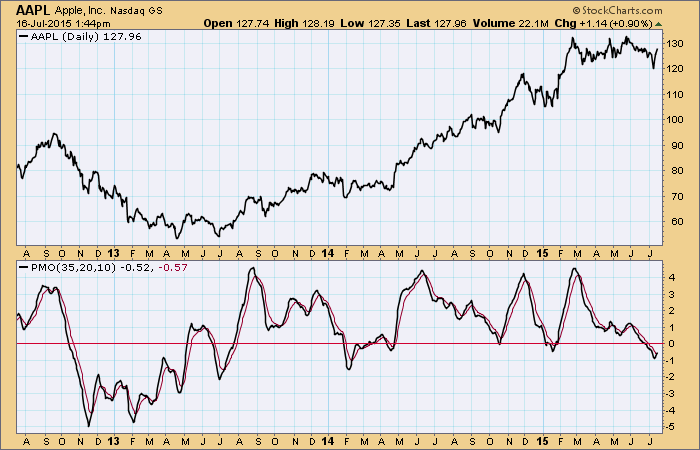
Carl's Answer: PMOs for the daily, weekly, and monthly time frames, while calculated with the same formula, are essentially different indicators. They are different because different data sets are used to calculate each one. The daily PMO is calculated using daily closing data, the weekly PMO uses weekly data, and the monthly PMO uses monthly data. The PMO in one time frame has no effect on the PMO in another time frame. It is price movement that affects the resulting PMO. Let's look at three charts covering a three-year period and using the different time frames.
The daily PMO is the most active because there are approximately 720 data points being used for the PMO calculation. (240 market days per year times 3.)
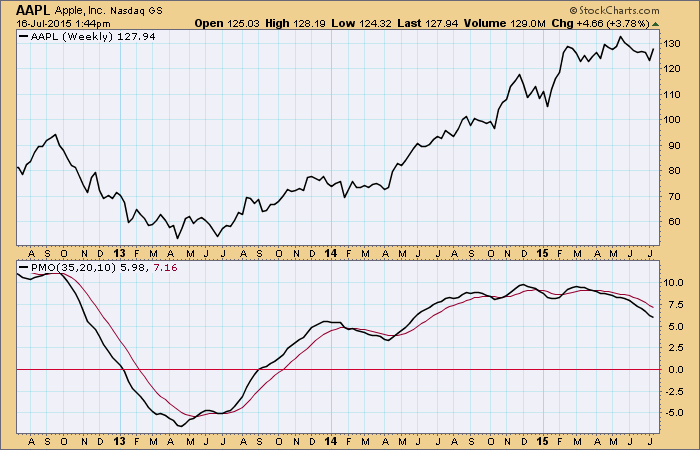
The weekly PMO is much smoother because it is derived from only 156 data points.
Finally, the monthly PMO uses only 36 data points for the three-year period.
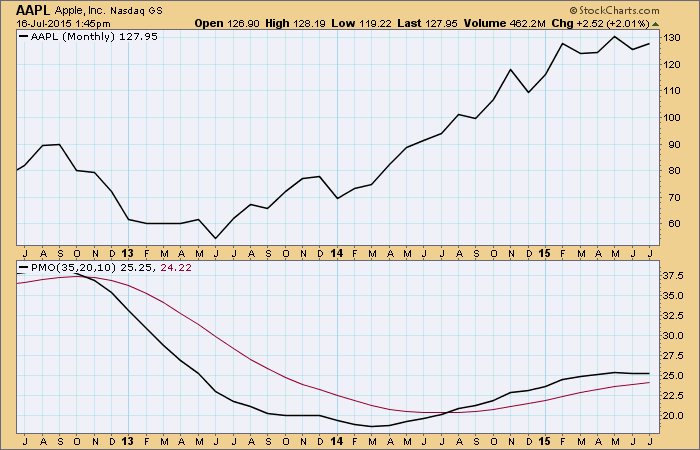
While we are only discussing the PMO here, the important point to be made is that all price indicators are calculated on this basis--a single formula is applied to data from different time frames. The use of weekly and monthly data smooths the price index as well as the the indicator which is calculated from the smoothed price data.
Subscribe to Carl's free blog and receive email whenever a new article is posted. See subscription links at the upper right corner of this page.
Technical analysis is a windsock, not a crystal ball.
