The DecisionPoint Scoreboard had an important signal change on the OEX. The DecisionPoint Trend Models have already triggered short-term Neutral and SELL signals on all four of the indexes we follow in our Scoreboard, but today, the OEX added an Intermediate-Term Trend Model (ITTM) Neutral signal. You'll note by just looking at the Scoreboard, the NDX is the last hold out as it remains on an ITTM BUY signal. The question is how close is it to falling in line with the other indexes.
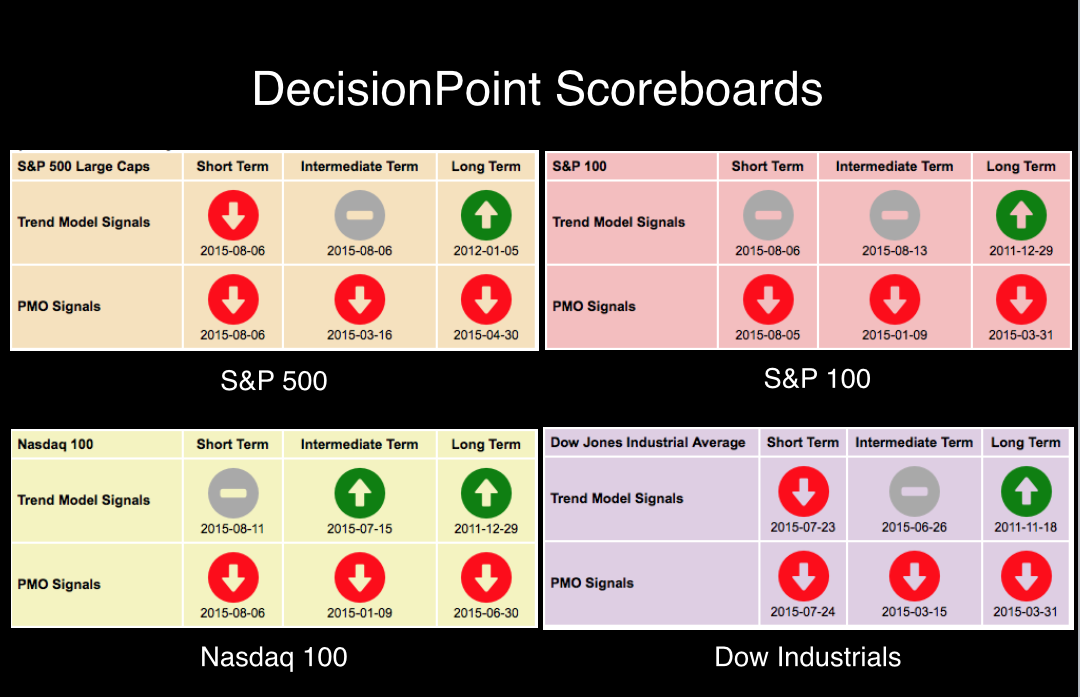
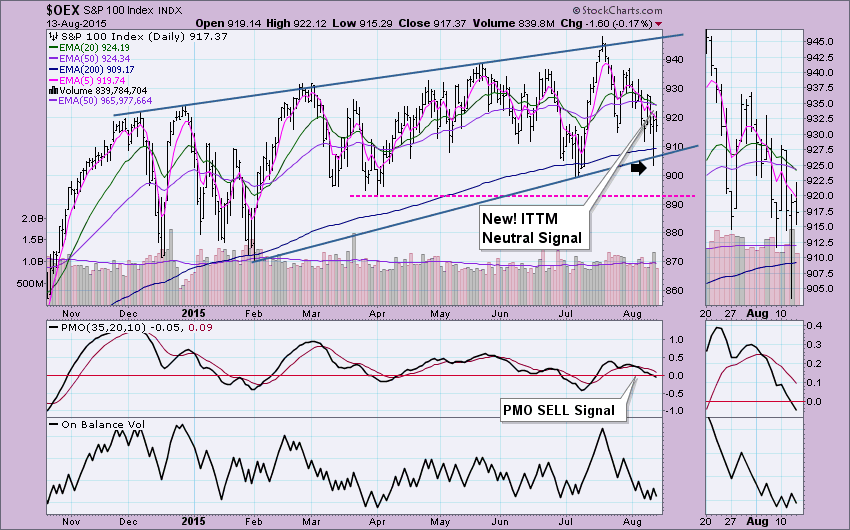
We can see on the daily chart for the OEX that price fell below the rising bottoms trendline yesterday, but it recuperated today. Unfortunately, it was unable to heal enough to bring price back above the 20/50-EMAs. With their decline today, there was a negative 20/50-EMA crossover that generated the Neutral signal. Had the 50-EMA been below the 200-EMA (implying a bear market), it would have been a SELL signal not a Neutral signal. Recall that as far as DecisionPoint timing models are concerned, a Neutral signal means you move to cash or are fully hedged; a SELL signal implies selling short. The Price Momentum Oscillator (PMO) is on a SELL signal and readings have returned to negative territory which is a sign of internal weakness.
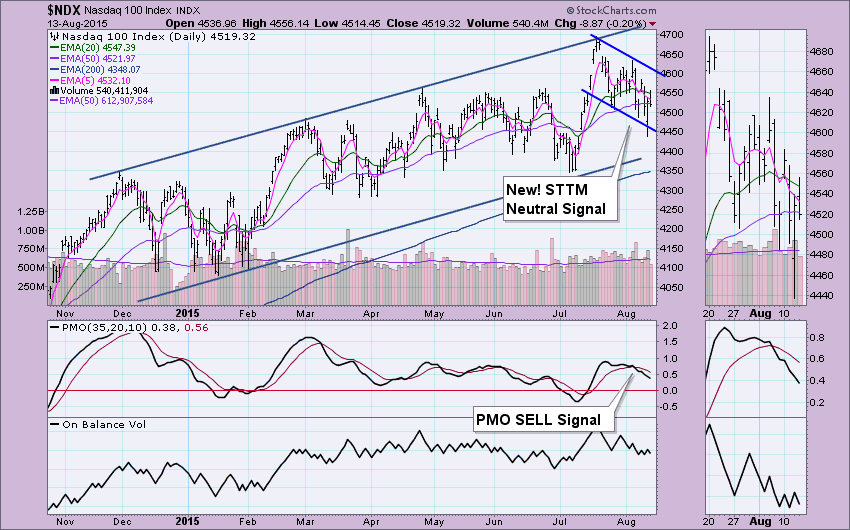
The NDX on the other hand, is in a steep decline and did incur a breakdown yesterday from the declining trend channel. A Short-Term Trend Model (STTM) Neutral signal has already been recorded on the Scoreboard. That leaves the ITTM and Long-Term Trend Model (ITTM). Unlike the other three indexes, the 20-EMA still has some space between it and the 50-EMA. Since we need the 20-EMA to cross below the 50-EMA for a new ITTM Neutral signal, more time will be required. The overall rising channel is positive, but as we move shorter term, price is in decline and negative momentum will continue to drag it lower.
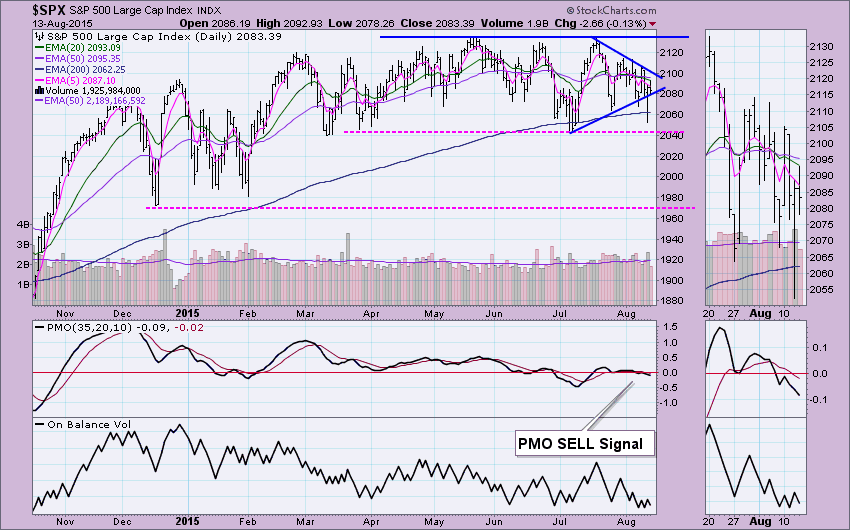
The EMAs on the $SPX have really bunched together, but the 5-EMA is starting to make separation and the recent ITTM Neutral signal occurred last week. The PMO is in decline after a SELL signal and the symmetrical triangle pattern was breached to the downside yesterday which does tell us there is a good chance the decline will continue.
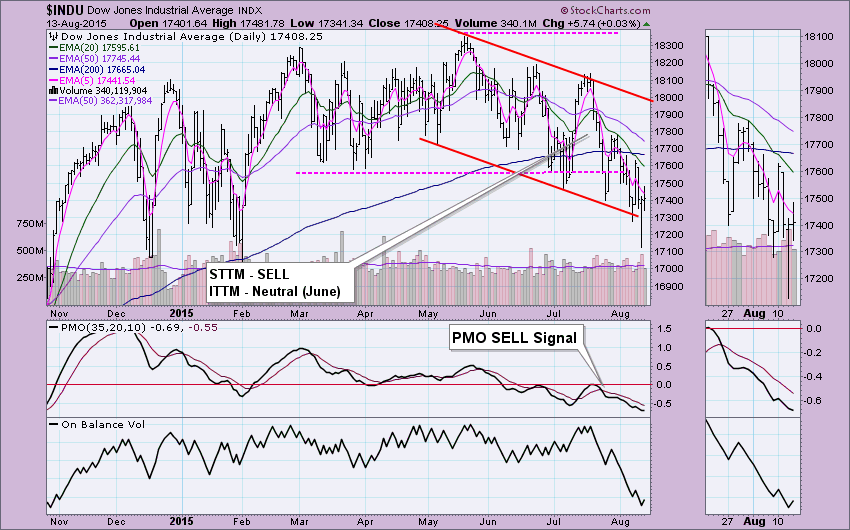
The Dow suffered yesterday, but like the others, managed to right the ship and get back inside the channel. For the Dow, the ITTM Neutral signal arrived very early in comparison to everyone else and was joined by a STTM SELL signal last month. What's particularly concerning is that the 50-EMA is about to cross below the 200-EMA. That would generate a LTTM SELL signal, significant because the current LTTM BUY signal has been in effect since late-2011.
Technical Analysis is a windsock, not a crystal ball.
Happy Charting!
- Erin
