Last week I wrote my blog article about small and mid cap stocks not participating in the recent rally which is a sign of instability in the market as a whole. A review of the daily price charts in that blog article for the S&P 400, S&P 600 and NYSE Composite displayed serious weakness, especially when compared to the large cap indexes we cover in the DP Chart Gallery. In the meantime, intermediate-term indicators have been rising on not only the large caps, but also the small- and mid-cap indexes. If you check out the intermediate-term indicator charts in the DP Chart Gallery, you'll see some deterioration and topping in overbought territory. A review of the intermediate-term indicators, the Intermediate-Term Breadth Momentum Oscillator (ITBM) and the Intermediate-Term Volume Momentum Oscillator (ITVM) on the small and mid caps and you'll see further weakness, including a downside crossover, which is especially bearish.
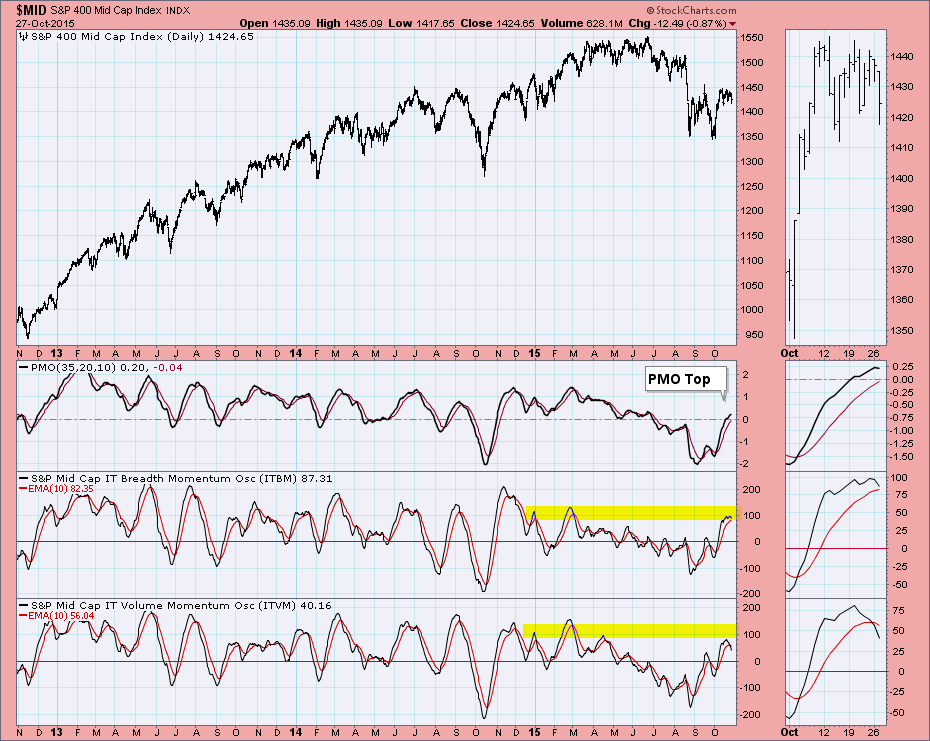
Look at the three charts below. You'll clearly see how overbought the ITBM and ITVM are, but more importantly, you can see that all have topped and in the case of the NYSE, had a negative crossover its signal line. I wrote in today's DecisionPoint Alert that these indicators tell us to expect at least a medium-term decline. You'll also note that all of the charts have Price Momentum Oscillators (PMOs) that have either turned down or are flat. The PMO measures positive and negative momentum, as the name suggests. When the PMO tops, momentum has shifted from positive to negative.
On the S&P 400 note that price has never been able to get above the September high. Also important, today's 0.87% decline can be compared to the S&P 500 which declined only 0.26% and the NDX which closed higher, up 0.18%. The ITVM has already had a clean negative crossover.
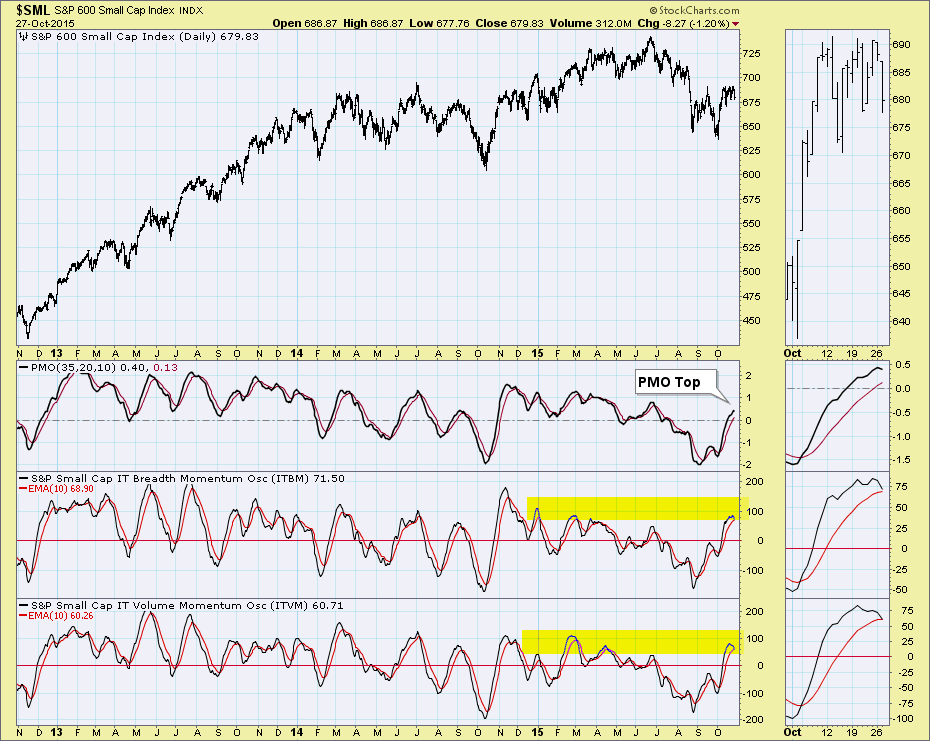
Price-wise, the S&P 600 suffered a 1.20% LOSS, even worse than the S&P 400. The ITVM will have a negative crossover tomorrow, barring a crazy rally. Price on the S&P 600 has not been able to break above resistance at the September high, something that the large caps have all managed with gusto.
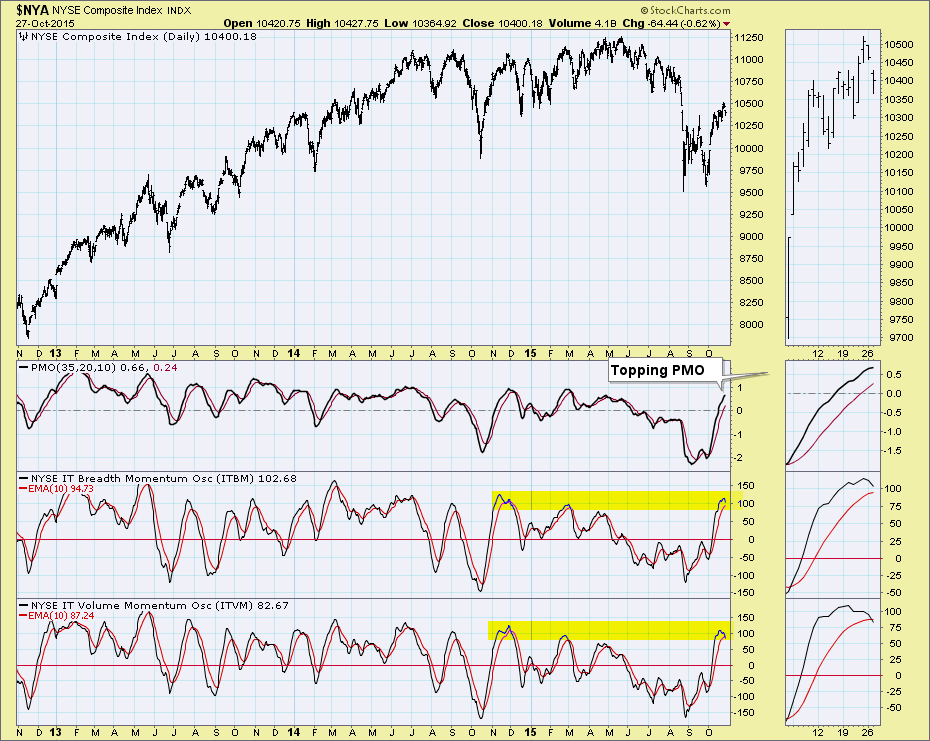
The PMO hasn't officially turned down and price has managed to get above the September high but the ITVM has had a negative crossover and the price decline (-0.62%) today was much worse than on any of the large cap indexes.
Conclusion: I invite you to check out the intermediate-term indicators on the four major indexes in the DP Chart Gallery (Basic or above membership required to view more than SPX) so that you can see the difference. Intermediate-term indicators have topped in overbought territory and in the case of the ITVM, two negative crossovers have occurred. Just looking at today's much steeper price declines on the small and mid caps compared to large caps is very telling.
Note: You can find the above intermediate-term indicator charts in the DecisionPoint Straight Shots ChartPack. Not only are there ITBM/ITVM charts for the indexes above, but for many more, including cap- and equal-weighted sector ETFs.
Technical Analysis is a windsock, not a crystal ball.
Happy Charting!
- Erin
