I really appreciate receiving your questions, emails and webinar comments. They so often will spur an article and it likely is of interest to many others if someone took the time to send it to me. So here is today's question:
"As for short term indicators, e.g., STVO, how do you analyze overbought resulting in a pull back verses market continues upward staying overbought as it did in OCT 2014?"
Let me preface by telling you I don't want to appear "defending" this bear market. All I can do is make observations and comparisons. Given the Long-Term Trend Model SELL signals on all but the NDX on the DP Scoreboards, I have to consider the longer-term bearishness when doing my analysis. One of many things Carl impressed upon me is that there are bull market rules and bear market rules and effectively, bear market rules tell us to expect bearish outcomes in a bear market. The recent short-term rally is impressive and has certainly given me food for thought as price has managed to close above the 50-EMA on the $SPX for a few days now.
The first chart I want to show you is from the DP Chart Gallery for the $SPX. The ultra-short-term indicator chart below gives us a quick read on market condition in the very short term (hours/days). Climactic moves are the key. When we see spikes or very elevated readings to the positive or negative, we need to determine whether it is an initiation climax (the beginning of a new trend or reversal) or an exhaustion climax (the end of the current trend or reversal). I've seen the current climactic readings as exhaustive from the start. Of course it appears that the first ones were likely initiation impulses, but the longer they stick around, the more we should be concerned with an end to the current trend. Looking at the current ultra-short-term indicator chart on the $SPX, the climactic spikes are obvious. Notice that when the market is rising strongly, the CVI congregates in positive territory. Yes, these readings are overbought and climactic and could represent an initiation. Notice the difference in the configuration of the VIX prior to the October bounce. It was below the bottom Bollinger Band. Right now, it is extended above the Bollinger Band. I added arrows on times the VIX was overextended and we can see it generally correlates to a price reversal. Price is arriving at resistance at the September high, so a test of the bulls conviction is pending.
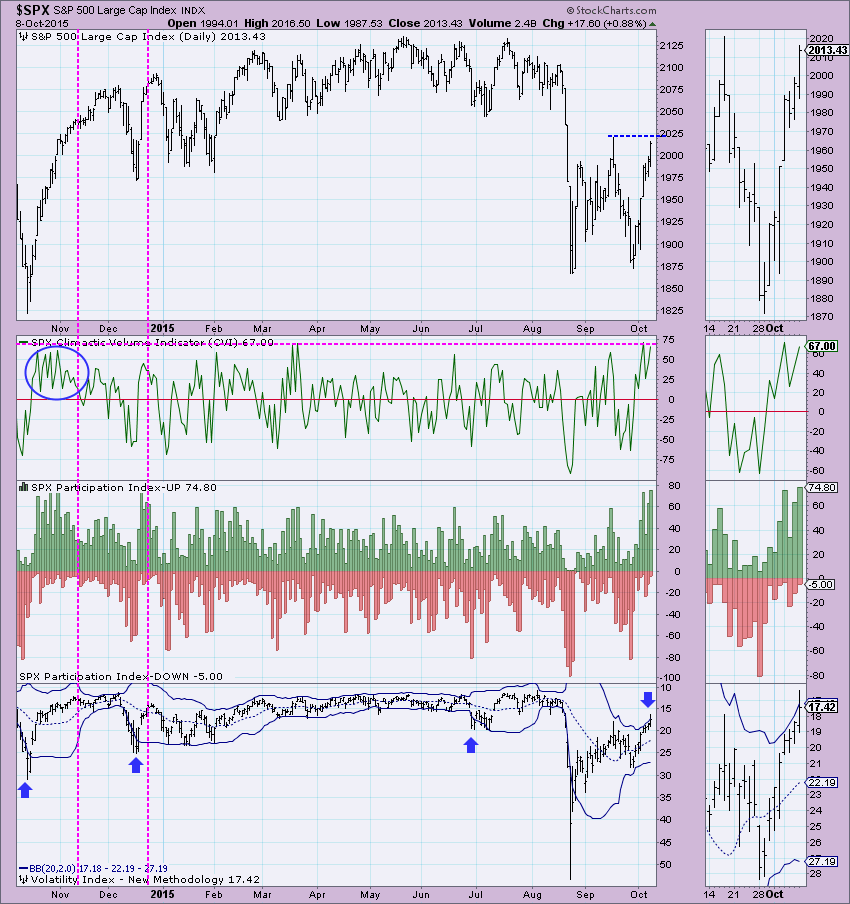
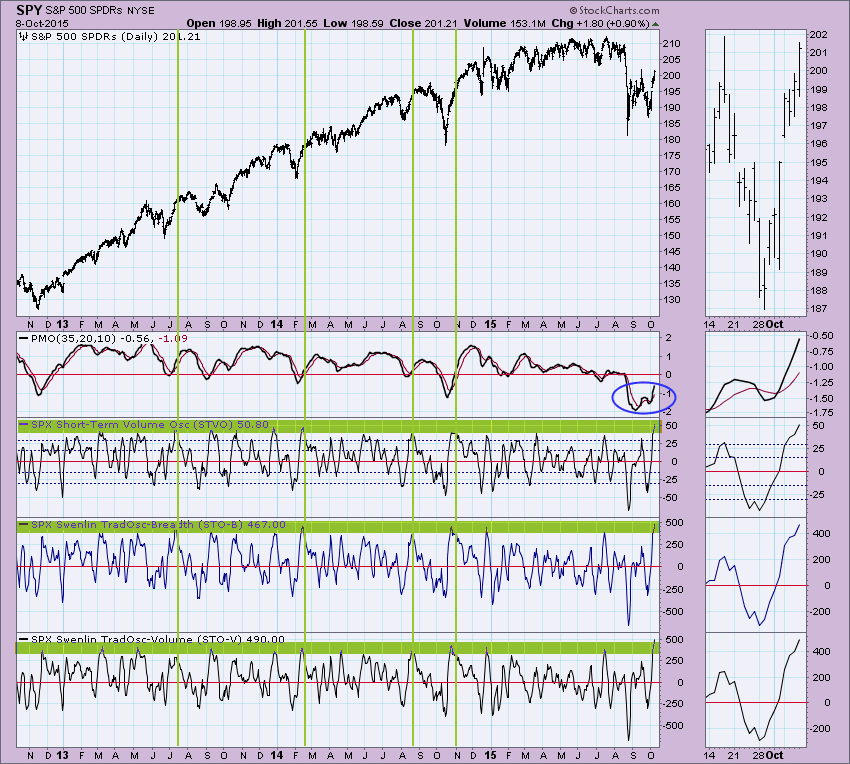
The Short-Term Volume Oscillator (STVO) was what my reader was asking about. Notice that it is highly overbought. That was also the case in October 2014, as my reader correctly points out. Typically these overbought readings precede tops or consolidation. Even in the case of October, the trend began to decelerate after these readings.
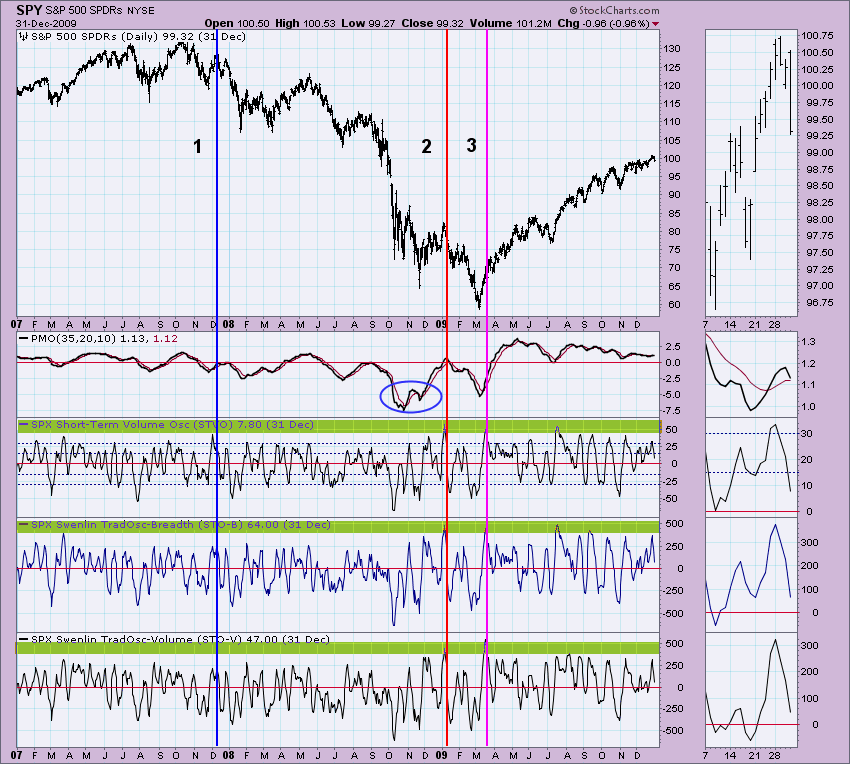
I thought it would be interesting to see what happens to overbought readings like these within a bear market. So I moved to a window to 2007 to 2010. There aren't many readings similar. I marked the only three lines I felt were representative of our current overbought conditions. Line 1 wasn't as overbought as we are now, but it did result in a decline. At line 2, the readings are very similar to now and they preceded a decline. Price action and especially the Price Momentum Oscillator (PMO) are very reminiscent of the current configuration of the PMO. We didn't see a well-orchestrated straight up move like you do before line 3 that ended the bear market. Might I suggest that rather than the end of the bear market, we are seeing a concerted effort by bulls to end it, but more shakeout (and decline) might be necessary first.
Conclusion: This very well could be the end of the bear market, but long-term trends are still very bearish with the 50-EMAs below the 200-EMAs on most indexes. I didn't talk about seasonality, but October is a well-known bearish month. My sense is that similar to the end of the bear market in 2009, more shake out and decline might be necessary first. The VIX is poised at a reversal point as it moved above the top Bollinger Band. Price is extended and in a bearish environment, so we have to consider bearish outcomes before bullish ones. I wouldn't be trying to get in now. I think that ship has sailed. However, clear these overbought short-term conditions with more decline and then we can talk.
