About a month ago $GOLD went on an IT Trend Model BUY signal, and I had this to say about it: The overall picture for $GOLD is bearish but showing improvement. The current BUY signal may offer some opportunities on the long side, and may even prove to be a long-term winner; however, my impression is that the conditions underlying this new BUY signal are far from robust. Also, $GOLD is in a bear market (the 50EMA is below the 200EMA), so odds are against a strong up move. Long positions should be stamped "Handle With Care."
On Friday the $GOLD 20EMA crossed down through the 50EMA, and since the 50EMA is below the 200EMA (LT bear market), the IT Trend Model switched back to a SELL signal. Considering my skepticism of a month ago, this signal change was not unexpected.
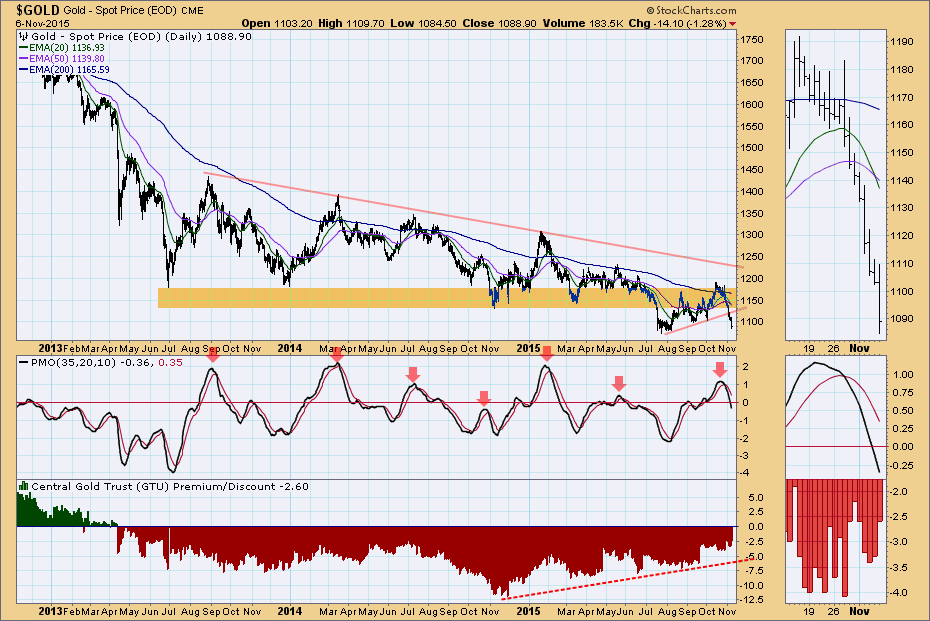
One indicator that provided early warning that the BUY signal was in trouble was the PMO. When a price index is in a bear market (the 50EMA is below the 200EMA), PMO tops are fairly reliable indications that a price top is at hand, and that long positions should probably be abandoned. If there is any doubt, the PMO crossing down through its signal line should remove that doubt.
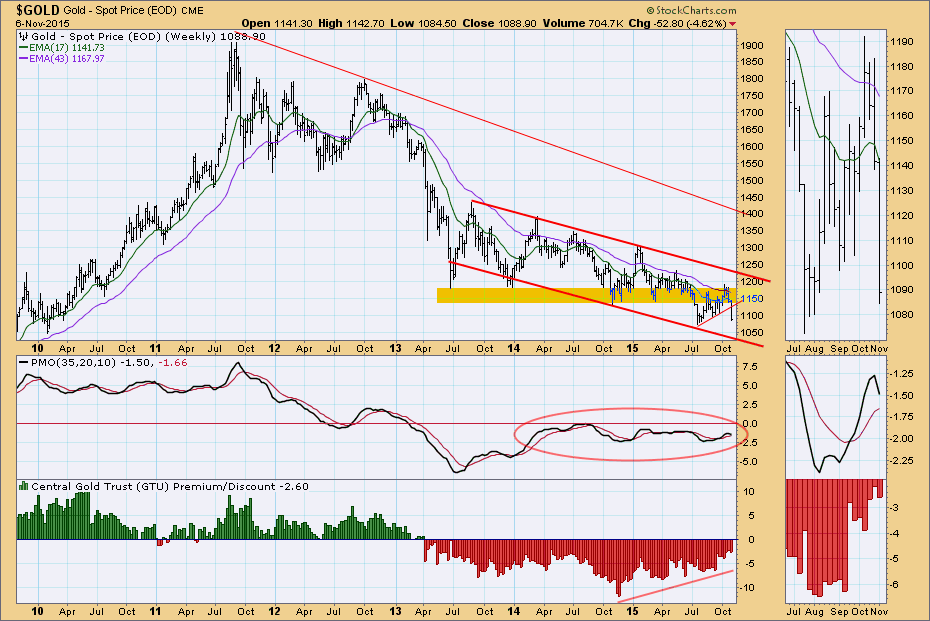
The PMO on the weekly chart below is moving sideways below the zero line, showing that momentum has been very stable, but it has been stable to the downside. In order to approximate a trend channel I have drawn a declining bottoms line that is parallel to the declining tops line. We can see that the last rally failed to reach the top of the channel. The bottom of the channel gives us a downside target of about 1040, provided, of course, that the declining bottoms line proves to be a solid line of support. I'm not so sure that will be the case. A positive aspect of the chart is that the discount for *Central Gold Trust (GTU), a closed-end fund that owns physical gold, continues to contract. This shows that investors are less averse to owning gold, in spite of continued price erosion.
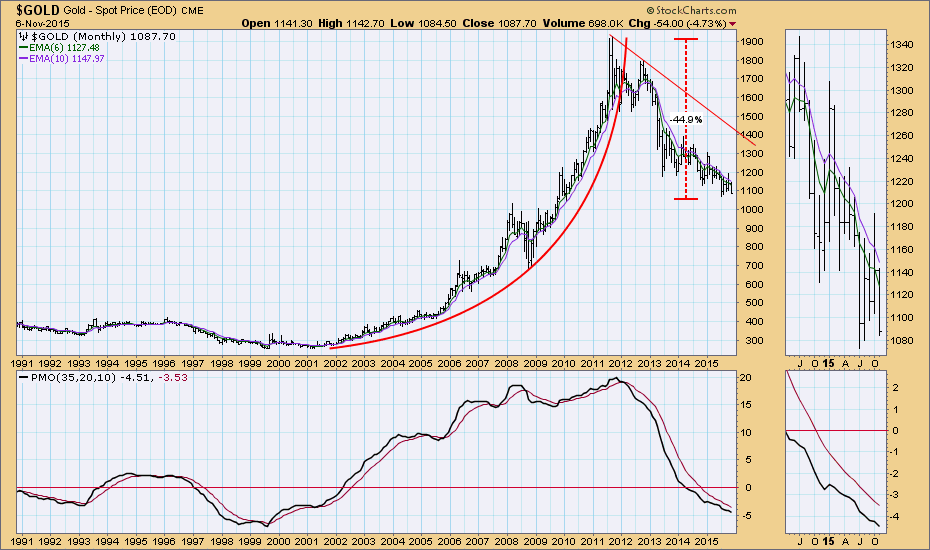
The monthly chart below shows that $GOLD is still declining after breaking down from an upside parabolic climax. Typically parabolic breakdowns decline a lot faster than is evident on this chart; nevertheless, $GOLD has declined -45% and has not reversed its down trend. One positive aspect of this chart is that the monthly PMO is nearing historical lows and is decelerating.
CONCLUSION: While $GOLD kind of leveled off in 2013 after a sharp decline, it has been in a slight but steady down trend for about three years. The trend channel on the weekly chart shows that price action has deteriorated in the last year and it appears that another retest of the channel support is imminent. I am not confident that the support will hold.
*Central Gold Trust (GTU) is a closed-end fund that owns physical gold. The fund trades like a stock and can sell at a premium or discount to the net asset value of the gold it owns.
Technical analysis is a windsock, not a crystal ball.
