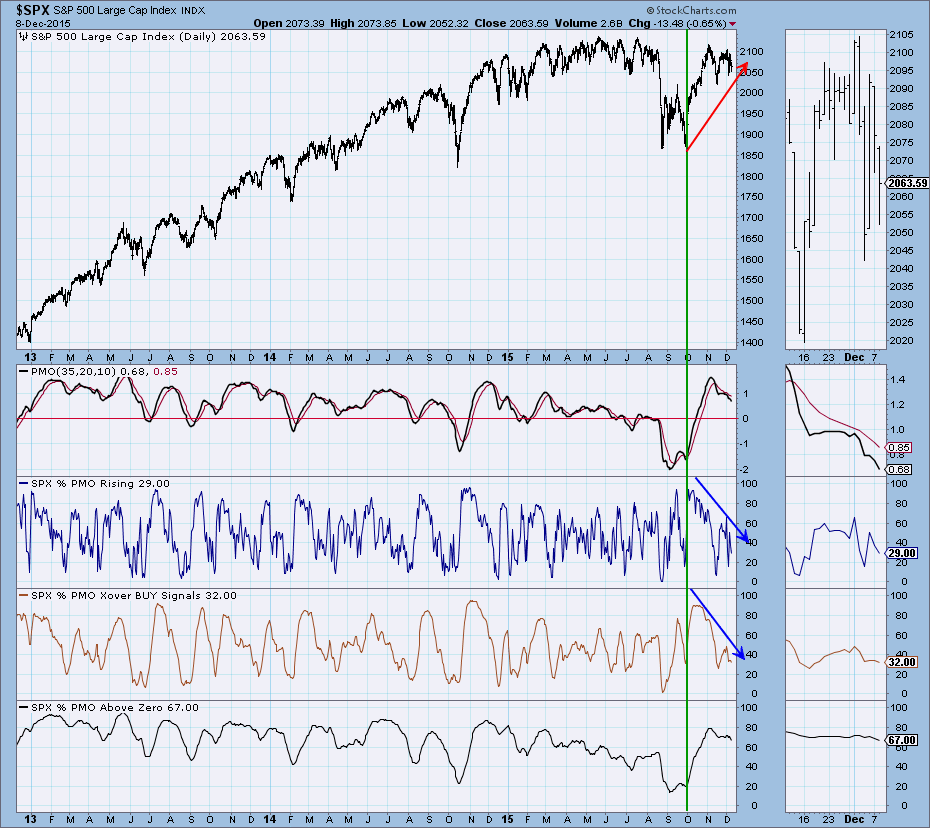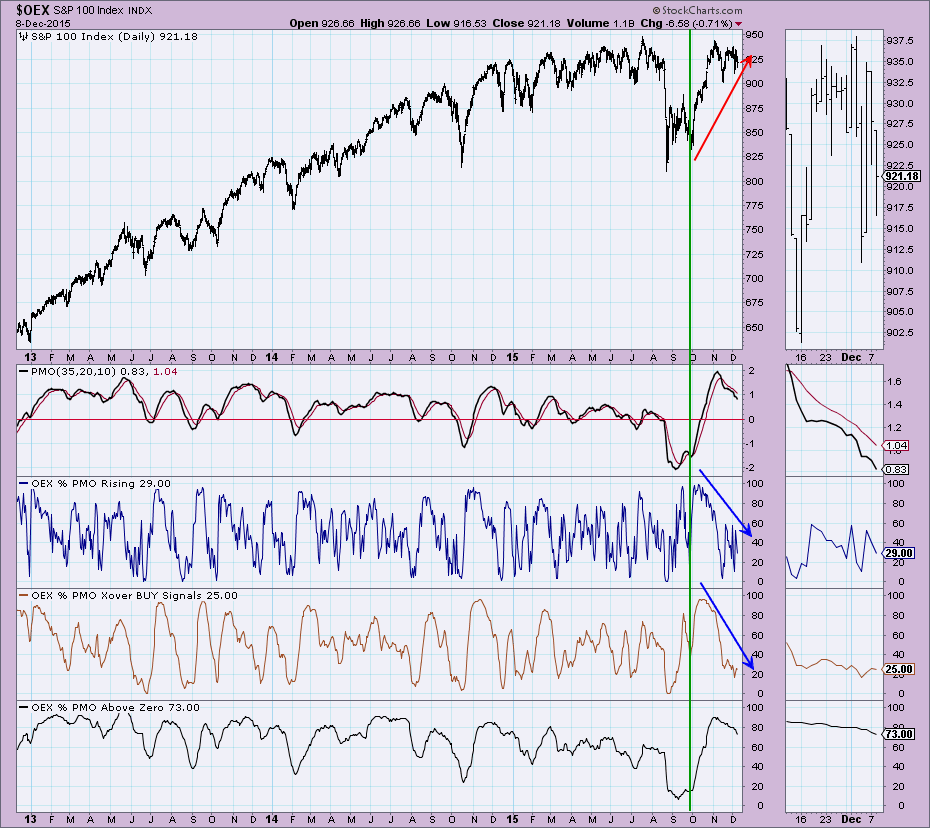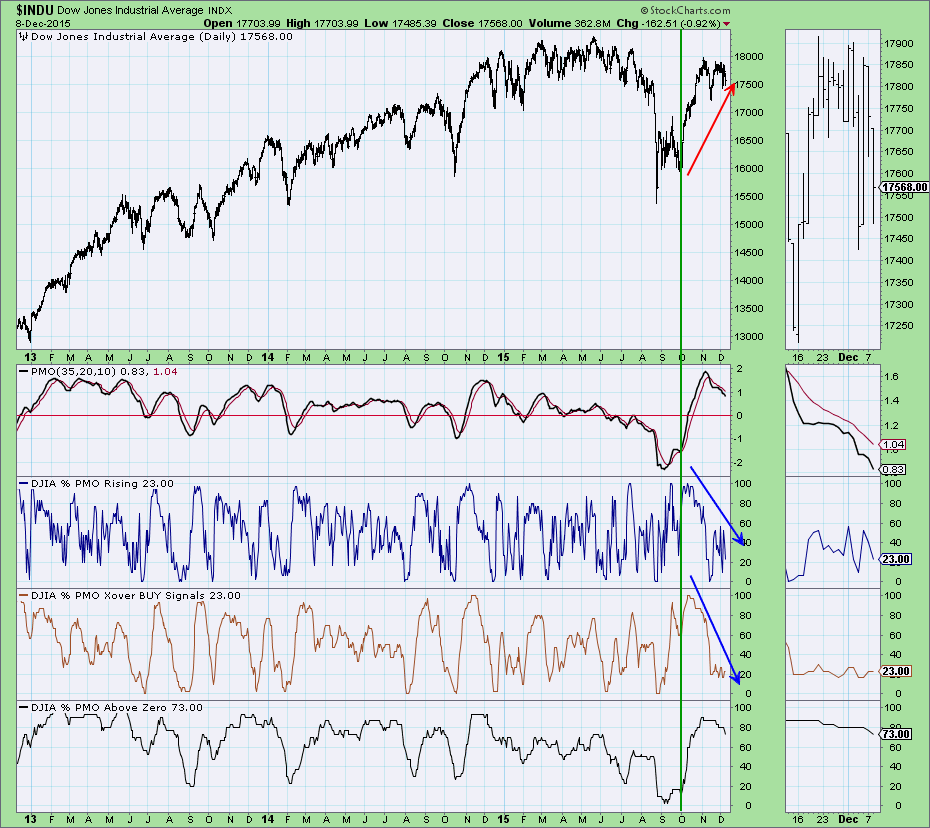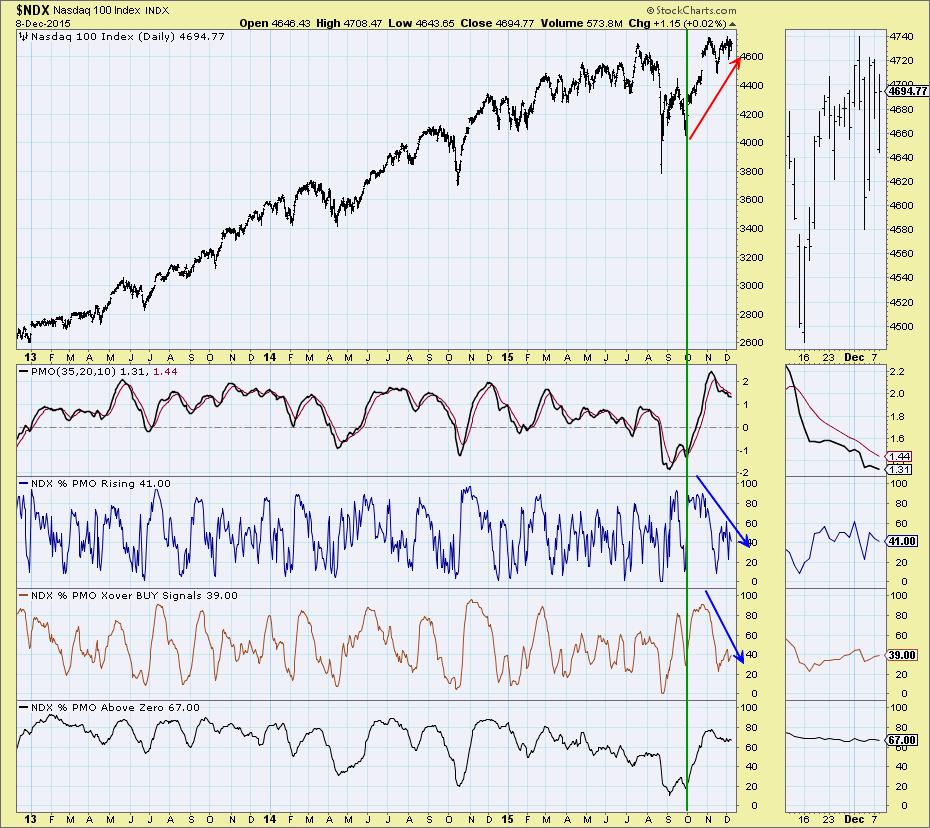
On October 29th this year, I wrote a similar article to today's about the significance of lack of market participation in the rally out of lows. I decided it was a great time to revisit these charts based on the current decline and to trace what happened after October 29th.
Despite a healthy rally out of the last bottom (note the red arrow), readings on the Price Momentum Oscillator (PMO) Analysis chart were declining and continue to decline. I want to make sure you are clear on what each indicator window is relaying as I analyze.
The first window is the percentage of SPX stocks with a PMO that is rising. You'll see the PMO right under price, so it should be a great visual to give you context. Less than 1/3 of the stocks in the SPX have rising PMOs, or positive momentum. This is a short-term reading. The second window refers to the percentage of stocks on crossover BUY signals, meaning the PMO is above its signal line. 2/3 of the stocks in the SPX are on SELL signals. This is a more medium-term view. The third window has the longer term view, the percentage of SPX stocks that have readings above the zero line. A PMO above the zero line implies longer-term positive momentum. It doesn't move that quickly. There are still 2/3 of the stocks with positive PMO readings. That number will need to shrink by plenty before it gets oversold enough to imply a significant rally.
Readings are similar on the other three indexes that we cover in the DecisionPoint Chart Gallery for members. The SPX chart above is also in the DP Chart Gallery, but charts on that index are free. Additionally for Extra members and above, you can download the free DecisionPoint Market Indicator ChartPack and you'll get these and many other PMO Analysis charts ready-made for you to analyze.
Conclusion: What should be specifically noted on all of these charts are the high readings on the percentage of stocks above the zero line. Looking at previous important price bottoms, these readings need to get below 30 or 40 for the best results.
Come check out the DecisionPoint Report with Erin Heim on Wednesdays and Fridays at 7:00p EST. The archives and registration links are on the Homepage under “What’s New”.
Technical Analysis is a windsock, not a crystal ball.
Happy Charting!
- Erin


