The preliminary S&P 500 Index third quarter earnings results are in, and once again we get to look at one of my favorite charts, which shows the S&P 500 in relation to its normal value range. (Note: The chart is a static graphic, not an active chart.)
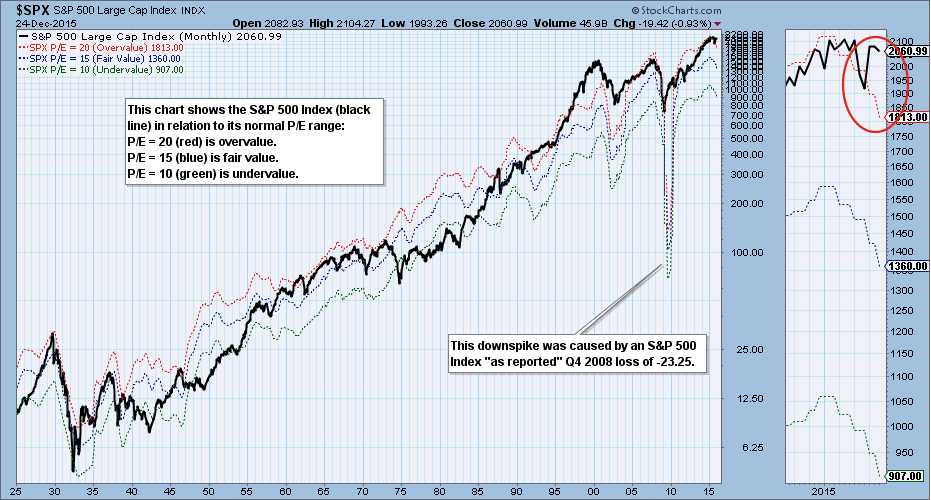
The bands on this chart show where the S&P 500 would be if it had an undervalued P/E of 10 (green), a fair valued P/E of 15 (blue), or an overvalued P/E of 20 (red). While the bands don't rigidly contain the range of the Index, they do help us get a quick assessment of the current valuation along with some historical perspective. The current P/E is 23, which places the Index well above the normal overvalue level of 20.
Many people believe that the P/E is irrelevant, and sometimes it really seems as if it is irrelevant when the P/E of some popular stocks move into the triple digits (Amazon has a P/E of 950). But as a general rule a P/E range of 10 to 20 should be considered normal, particularly for a broad market index like the S&P 500. When those limits are exceeded, it is a good idea to find out why. In the case of the S&P 500, earnings have been trending down since the beginning of this year, which is a little more more serious than rising prices just getting ahead of rising earnings.
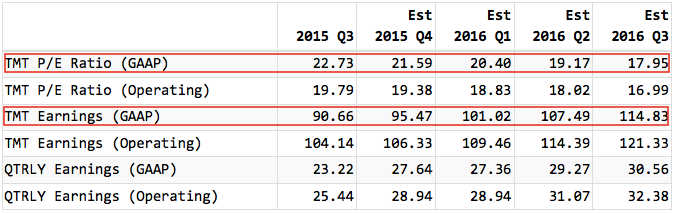
In the table below twelve month trailing (TMT) earnings are projected to increase over the next four quarters, which in turn will cause the P/E to drop (if the index value stays the same); however, we cannot be sure that estimates will be realized.
Source: standardandpoors.com
CONCLUSION: With the S&P 500 Index being higher than its normal P/E range, and with earnings trending down, the fundamentals are working to pull prices downward. Earnings are projected to improve over the next twelve months, which could result in the Index being just somewhat overbought. But there are variables: Will earnings meet or fall short of expectations, and will prices move higher or lower? For now, what we do know is that the S&P 500 is overvalued and earnings have been trending downward, and that has negative implications for future prices.
Technical analysis is a windsock, not a crystal ball.
