My favorite part of my webinars is the "Question of the Day". I welcome emails and comments from my readers as you challenge me to think outside of the box or clarify my analysis. So here is today's question from Bryant regarding the weekly Price Momentum Oscillator (PMO) movement on Netflix (NFLX):
"I finally recalled and found the chart I was most interested in asking you about, it is a weekly chart of NFLX over 3 years. Once the weekly PMO line crossed below the signal line in 2013, despite the move from 35 to 70 from 2013 to 2014, the weekly PMO did not cross over the weekly signal line until early 2015 (which of course was a good buy signal for 2015). My question is about the long term, using the weekly PMO as a buy/sell guide. Did NFLX simply rise too slowly in 2013 to 2014 for the weekly PMO to show a buy crossover?"
Before looking at specifics with NFLX, I want to talk about the PMO. As the name says, the PMO is an "oscillator" and oscillators must oscillate. When they hit overbought or oversold extremes, they have to unwind. Additionally, it isn't just the BUY/SELL signals that help us, it is also important to watch for divergences.
Let's look at the weekly PMO on NFLX. I've highlighted the weekly PMO downside crossover that Bryant was referring to and the price action that followed. The 2013 weekly PMO SELL signal arrived in very overbought territory. Signals tend to be better when they come at extremes so seeing price continue higher was confusing. Remember the PMO must oscillate, so it began to unwind in spite of price rising. Note that the descent was not steep or accelerated during the rest of 2013, it was the PMO decompressing. However, that area turned out to form a negative divergence and preceded a choppy and mostly unprofitable 2014.
The PMO BUY signal that arrived at the end of 2014 also arrived when the 17-week EMA crossed above the 43-week EMA which bolstered the likelihood that the signal would be profitable. The 2013 SELL signal arrived within a strong uptrend while the 17-week EMA was comfortably above the 43-week EMA. At that point, I would want to review the daily chart and monthly charts to determine whether this particular weekly PMO SELL signal was going to be a 'good' signal. My preference is to use the weekly PMO as supporting evidence rather than the primary signal.
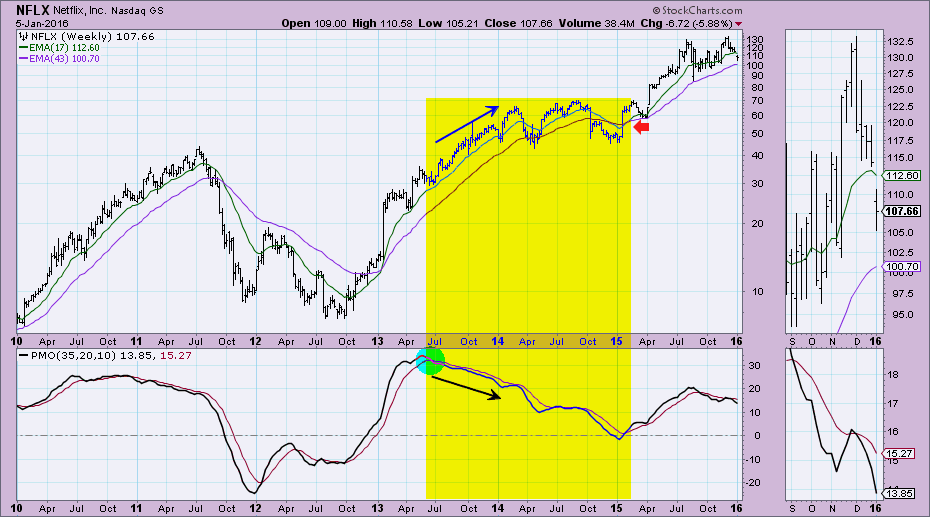
So, Bryant, in answer to your question, what likely happened with the 2013 weekly PMO SELL signal is that the PMO was stretched out from the previous price rise. As an oscillator, it needed to decompress. So even though the rising price trend was never interrupted, the PMO drifted lower to clear those overbought extremes. It continued lower through 2014 as the rising price trend deteriorated and the 17/43-week EMAs had a negative crossover. At the beginning of 2015, the PMO had a positive crossover just as the 17/43-week EMAs had a positive crossover which indicated the signal would likely be a good one.
Come check out the DecisionPoint Report with Erin Heim on Wednesdays and Fridays at 7:00p EST. The archives and registration links are on the Homepage under “What’s New”.
Technical Analysis is a windsock, not a crystal ball.
Happy Charting!
- Erin
