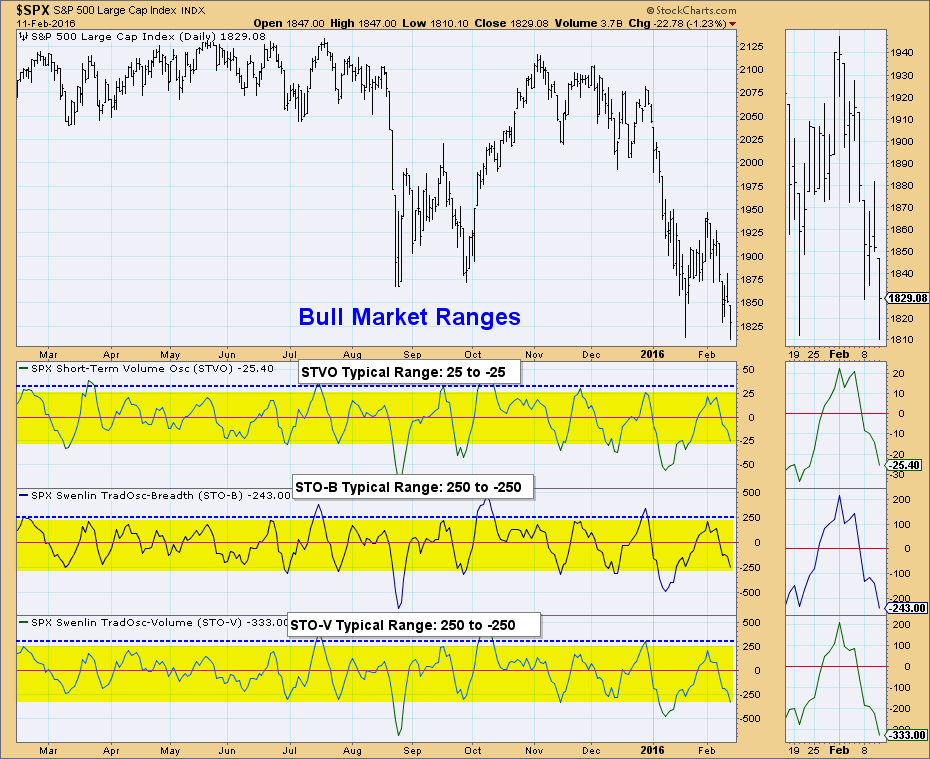
I think we can all agree that we are currently consumed in a bear market. If you remember the Bear Market Rules article I wrote last year, I discussed how our bullish expectations need to be tempered. Part of that is realizing that "oversold" in a bear market doesn't mean the same thing as in a bull market. In a bull market it is a reasonable expectation to see a nice rally. In a bear market, oversold conditions are dangerous and while they can pick up small rallies (though not always), they generally will finish with another larger sell-off. One thing I noticed is that the regular ranges for our short- and intermediate-term indicators in a bull market, are not the same as in a bear market. Mainly, oversold territory expands a great deal while overbought territory shrinks somewhat.
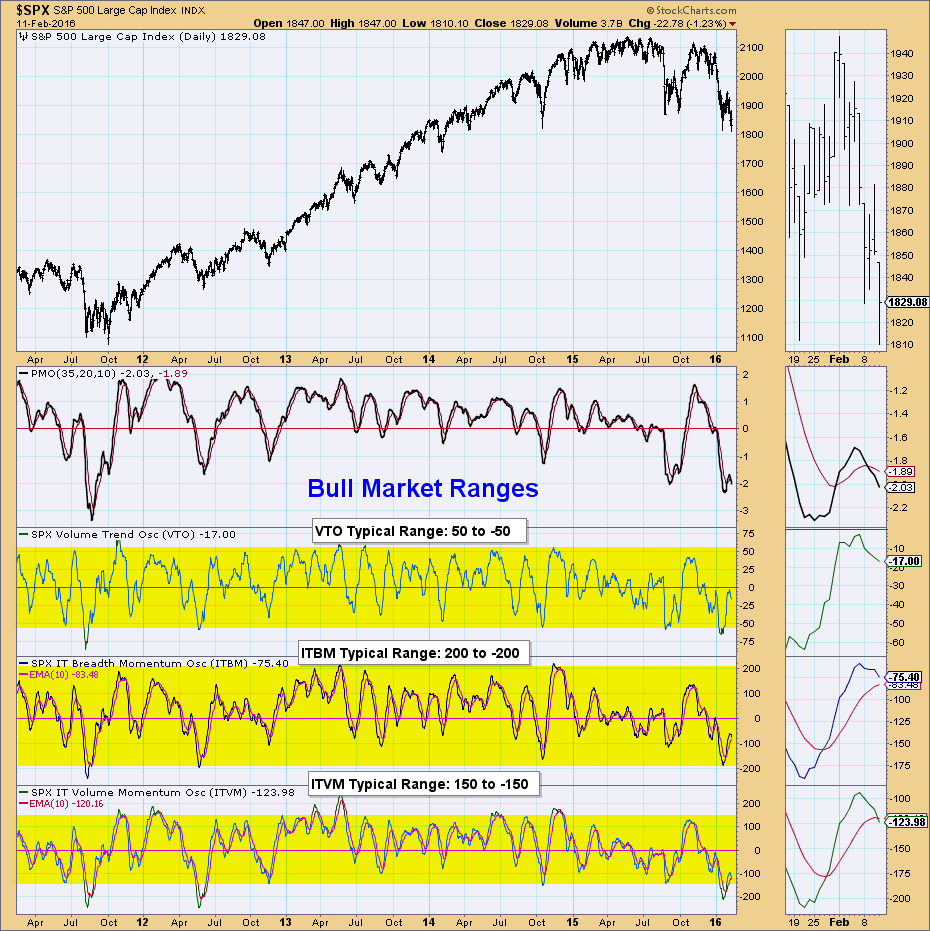
The most recent short-term and intermediate-term indicator charts are below. I've marked what the typical range is in a bull market. The readings will populate equally around the zero line. Readings will expand past these ranges periodically, but these ranges endure. Notice that they expanded downward at the beginning of the year when all of our indexes entered into bear markets (50-EMA crossed below 200-EMA).
Notice that the readings of the ITVM fall near the bottom of the bull range, which would mean oversold. The VTO and ITBM are neutral to somewhat oversold. But wait...
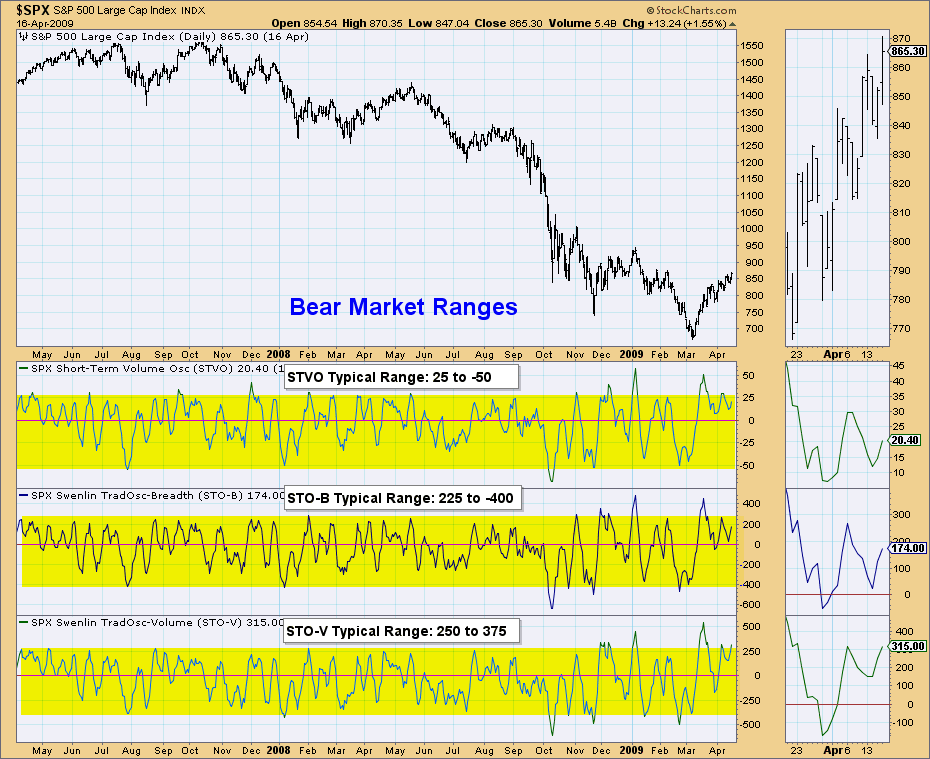
Look at the same charts during the 2007-2008 bear market. The range has moved lower. What may appear "oversold" in a bull market, isn't in a bear market. The readings as they stand are more neutral and in some cases overbought, meaning they can accommodate much lower prices without the need of a rally to decompress.
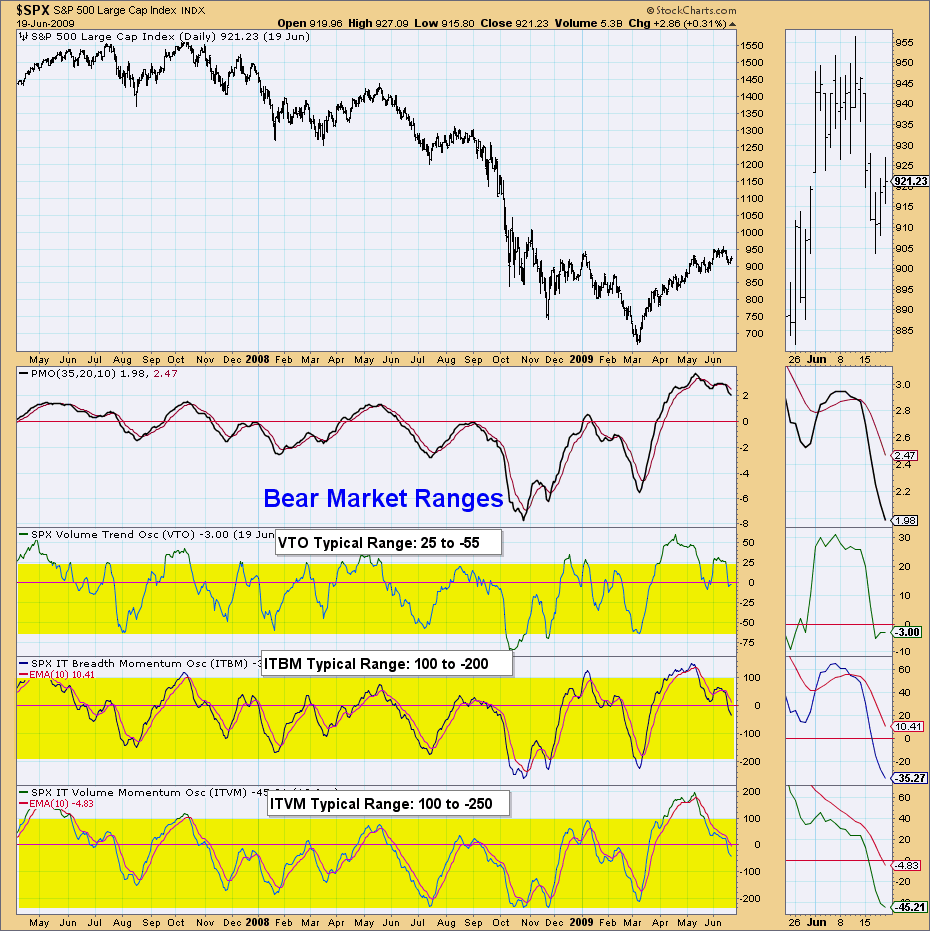
Conclusion: You may want to evaluate the ranges of your oscillators during bull and bear markets. I am now looking at my oscillators in a new light. What appeared oversold is actually neutral. So instead of expecting a rally, I need to reevaluate. They are neutral AND falling, and that dear readers, is bearish for the short and intermediate terms.
Come check out the DecisionPoint Report with Erin Heim on Wednesdays and Fridays at 7:00p EST. The archives and registration links are on the Homepage under “What’s New”.
Technical Analysis is a windsock, not a crystal ball.
Happy Charting!
- Erin
