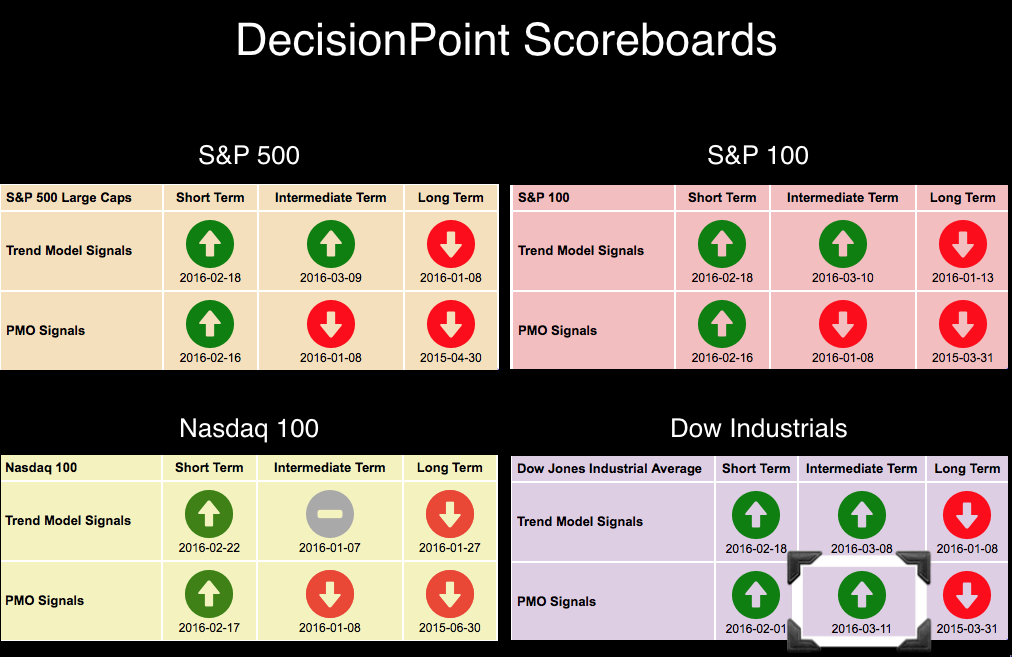
 Short-term and Intermediate-Term Trend Model BUY signals began appearing on the DecisionPoint Scoreboards this week. I suggested in a previous ChartWatchers article that these signals would be the first indication that the bear market may be coming to a close. I also wrote that the next step would be to see the weekly Price Momentum Oscillators (PMOs) on the DP Scoreboards have positive crossovers. The first of those signals, appeared today on the Dow Industrials.
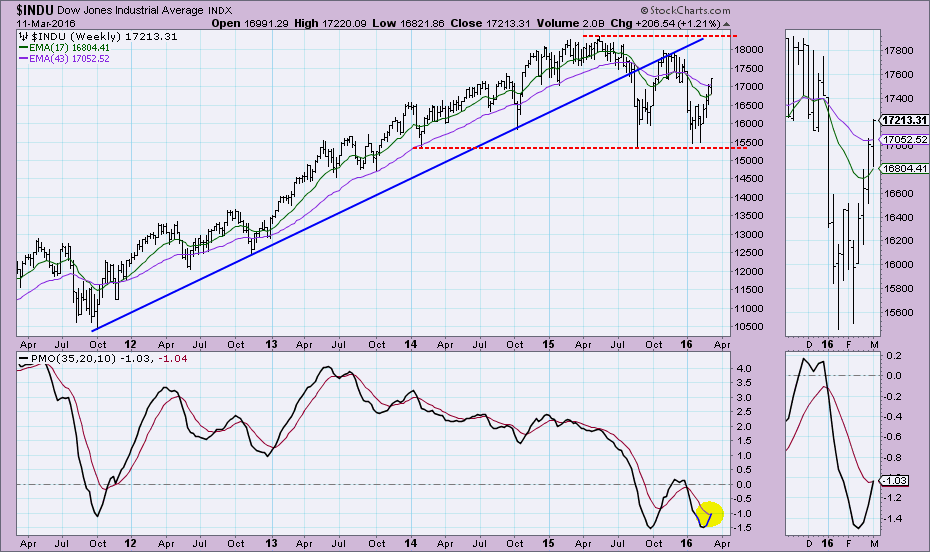
Below is the weekly chart where you can see the positive PMO crossover in oversold territory. It is important to note that we saw a previous PMO crossover BUY signal at the beginning of the consolidation zone in October followed by a SELL signal after the sizable decline at the end of 2015. We have seen these signals fail.
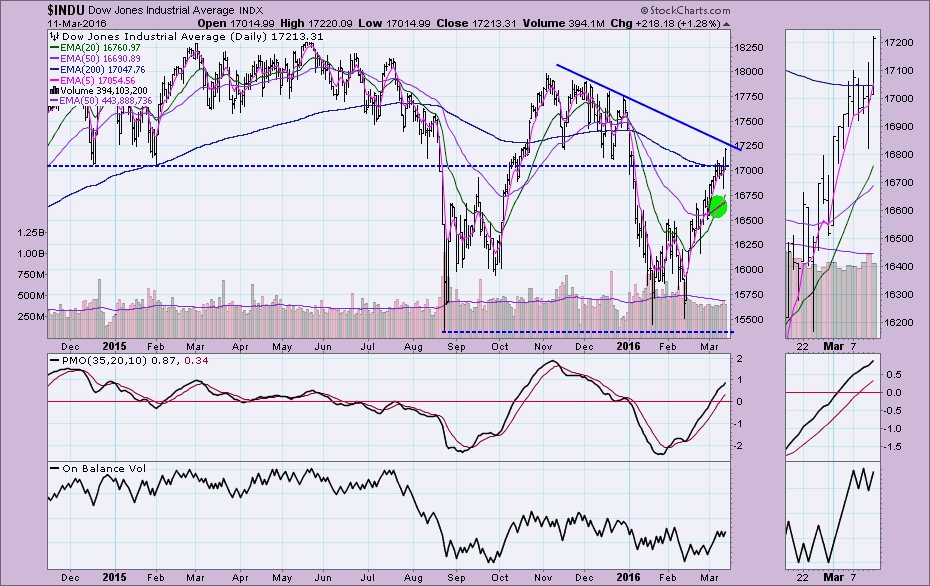
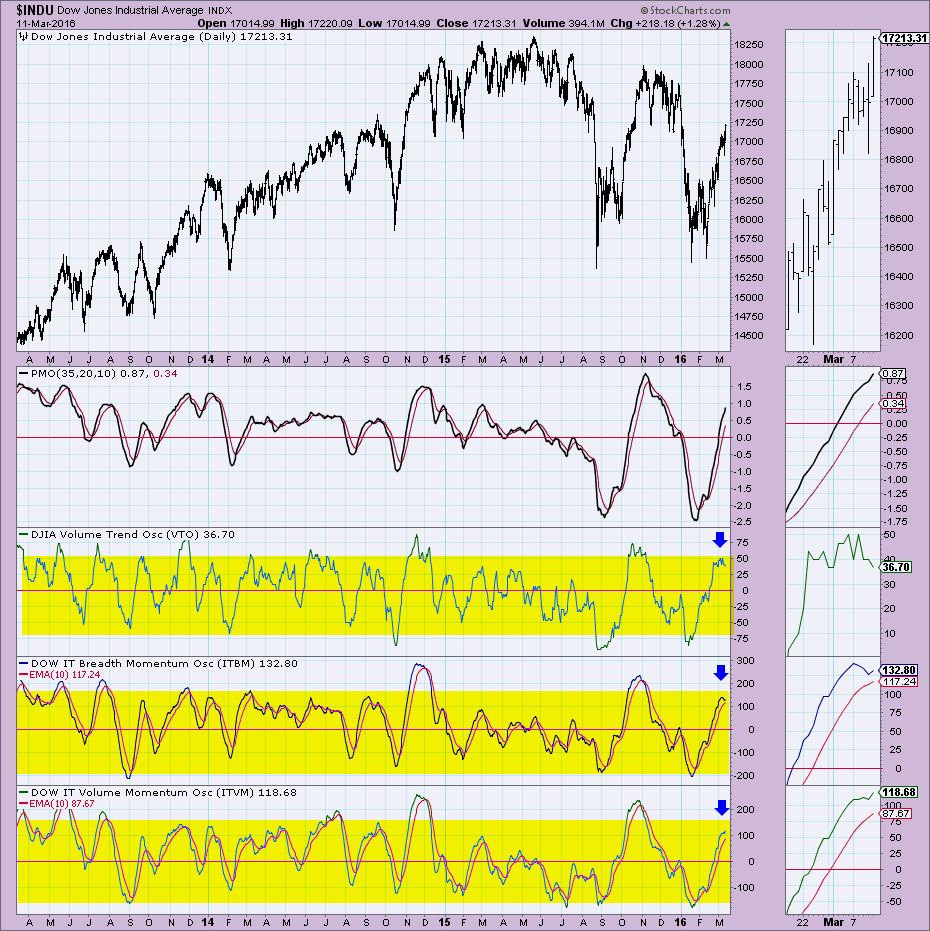
However, I am much more optimistic in the shorter term when I look at the daily chart and short-term indicator charts. The PMO is rising and is only somewhat overbought. The recent ITTM BUY signal is positive. Mainly seeing price breakout above long-term overhead resistance is compelling. I have annotated a declining tops line mainly as a way to confirm this breakout should break through. If we see a breakout or continuation, I would look to overhead resistance at 17500 or possibly 17750.
Why, you ask, have I not switched completely bullish on the Dow? These indicator charts are why. The shorter-term charts are bullish, but the intermediate-term indicators are very overbought and thus bearish. They must turn down and the way for that to happen is a medium-term decline.
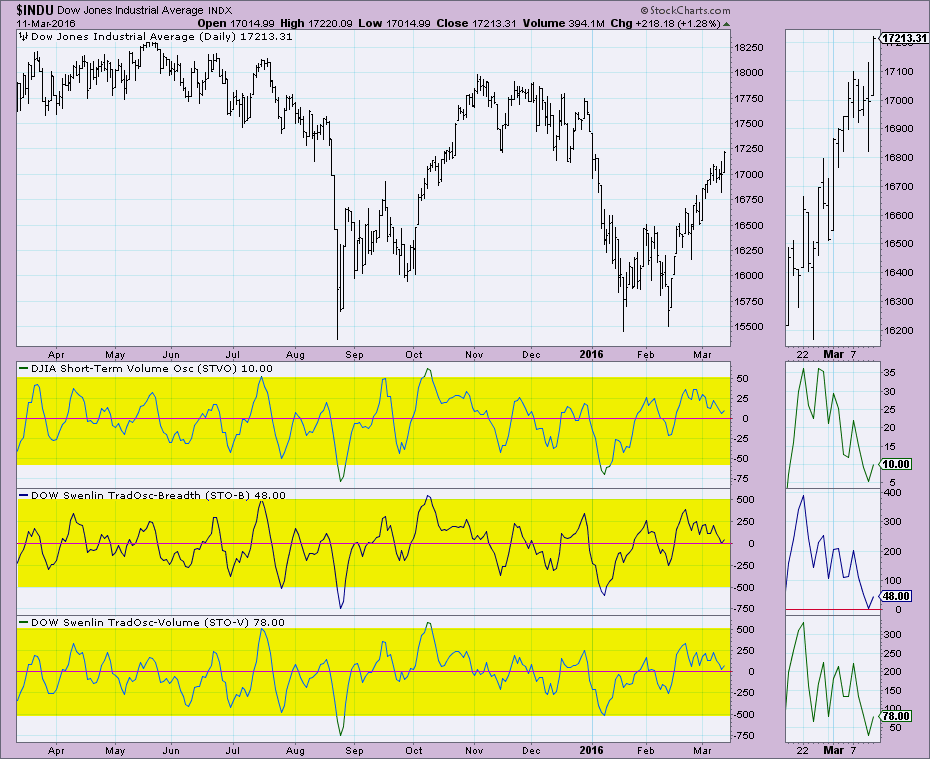
The very short-term or ultra-short-term indicators had climactic positive readings. When we get these type of readings, we try to determine whether it is an initiation to higher prices or is it an exhaustion. Given today's very bullish candlestick and strong breakout above overhead resistance, I believe we are looking at an initiation to higher prices. Remember! These indicators are very-short-term, so a rally of a few days is about all this chart is saying.
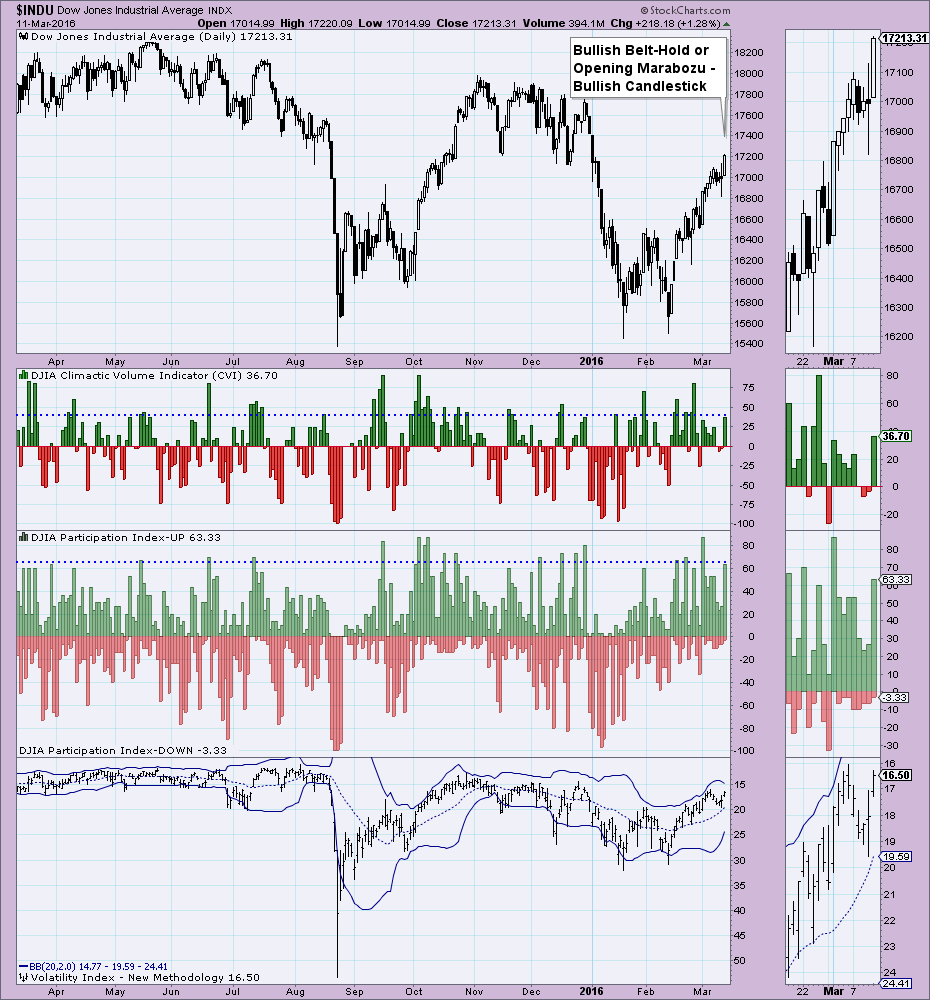
Short-term indicators are in decline and are now reading neutral. Neutral is dangerous as it supports either direction. They are trending down and have been during the rally which is quite bearish, but the breakout was important and the new PMO Weekly crossover BUY signal is signficant. They have all turned up today which is positive.
The problems lie with the intermediate-term indicators. They are very overbought for a bear market and are overbought for a bull market as well. These conditions cannot persist indefinitely, a decline is needed. Medium-term therefore, is bearish.
Conclusion: Large caps have been enjoying quite a rally and the Dow has led the way. Yet, too many other indexes are lagging, like the Nasdaq 100 and small- and mid-cap ETFs (see my webinar today here). The end of the bear market would need those laggards to find similar success.
Come check out the DecisionPoint Report with Erin Heim on Wednesdays and Fridays at 7:00p EST, a fast-paced 30-minute review of the current markets mid-week and week-end. The archives and registration links are on the Homepage under “What’s New”.
Technical Analysis is a windsock, not a crystal ball.
Happy Charting!
- Erin
