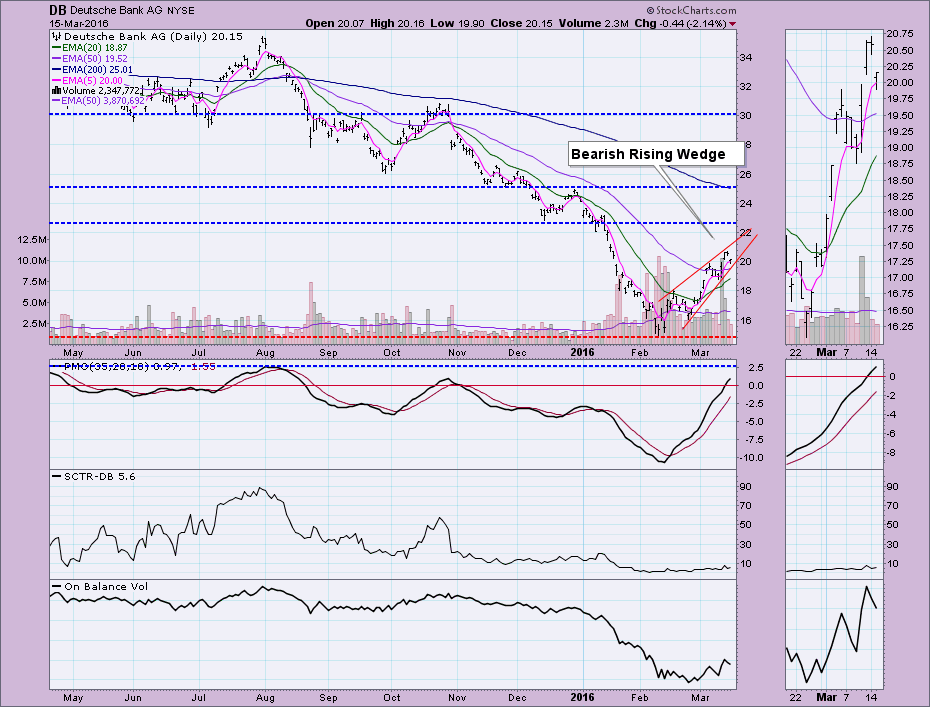
A reader and viewer emailed me and asked me to take a look at Deutsche Bank (DB). While I normally don't do specific chart reviews as part of my blogs or webinars, today we received a new Intermediate-Term Trend Model (ITTM) BUY signal on the equal-weight Financial ETF (RYU). The Financials SPDR (XLF) hasn't yet triggered an ITTM BUY signal, but it is getting close. The question is whether this is really a recovery in the Financials sector. If you look at the DecisionPoint Market/Sector Summary (found in the DP Reports blog) below, you can see that it has been moving "green" during this extended bear market rally.
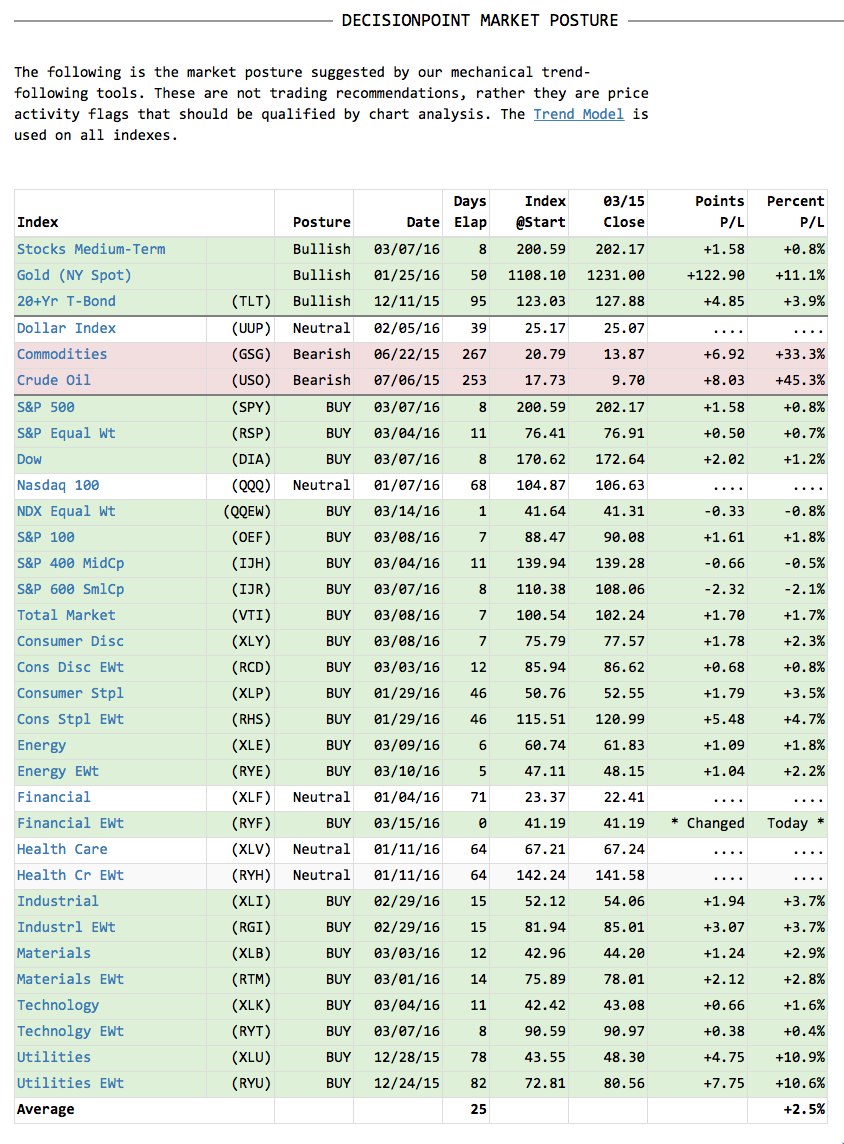
Let's start with RYF which received the new ITTM BUY signal today. One thing you'll notice about the DecisionPoint Market/Sector Summary above is how green it is. BUY signals have been trickling in throughout this rally. When the summary begins to "flip" green as a whole, it has the markings of a new bull market rally. However, we are technically in a bear market, so I would expect to see them begin flipping backwards soon. I've annotated the positive 20/50-EMA crossover that triggered the ITTM BUY signal today on RYF. Of concern is price reaching overhead resistance and being turned away. The Price Momentum Oscillator (PMO) is reaching overbought territory and OBV is flat. Seems this signal has arrived late to the party.
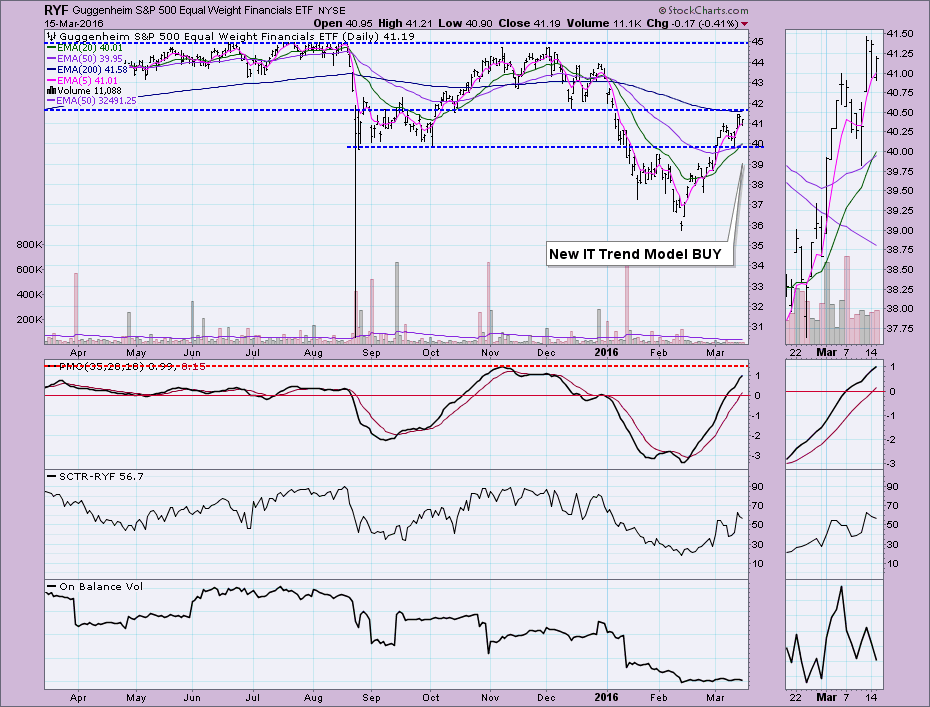
XLF is very near a positive 20/50-EMA crossover which would generate an ITTM BUY signal. It is positive that it was able to capture and hold support at around 22.00, but this week the closes have been negative. Price didn't reach overhead resistance. I didn't annotate it, but a rising bottoms trendline could be drawn to form a bearish rising wedge. The distinct negative divergence between price and the OBV is also a problem.
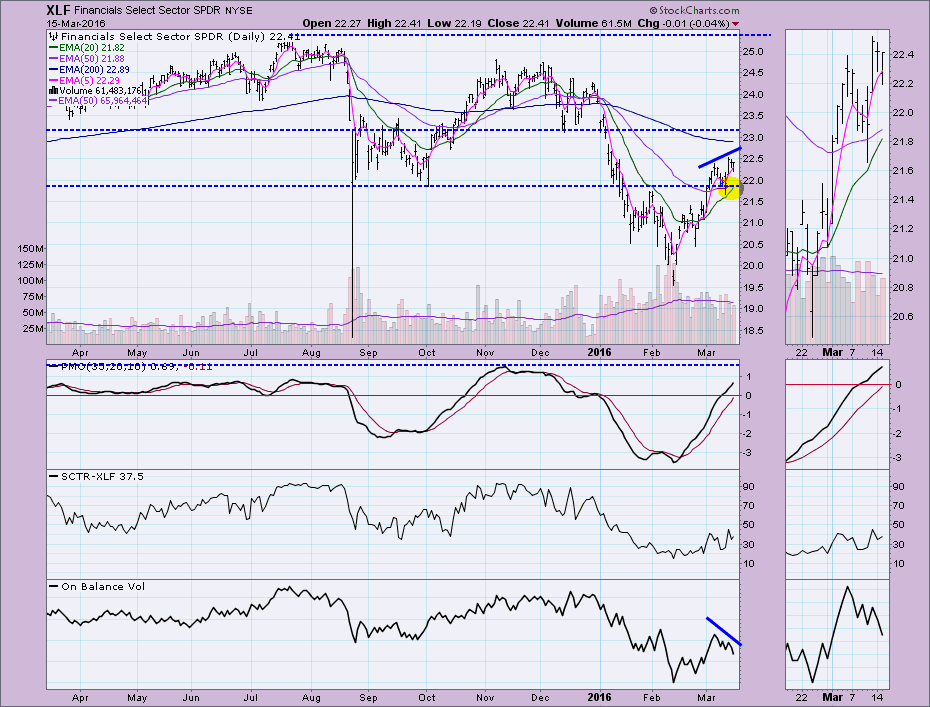
The set-up appears promising on DB until you begin drawing in trendlines. A very clear bearish rising wedge has formed and note that the PMO is reaching short-term overbought territory. An ITTM BUY signal can't be generated if price falls below the 50-EMA and price is perilously close. There are several areas of overhead resistance and based on today's deep price decline, it appears that it is turning back even before testing the first area of overhead resistance.
Conclusion: Just because an ETF or stock triggers an ITTM BUY does not necessarily mean "buy it now". As with PMO BUY signals, a chart review is required. As we can see, the Financials sector has been lagging and has finally joined the rest of the sectors on the Market/Sector Summary with a BUY signal; however, a closer look at the charts reveals weakness.
Come check out the DecisionPoint Report with Erin Heim on Wednesdays and Fridays at 7:00p EST, a fast-paced 30-minute review of the current markets mid-week and week-end. The archives and registration links are on the Homepage under “What’s New”.
Technical Analysis is a windsock, not a crystal ball.
Happy Charting!
- Erin
