In my previous two articles, I defined the components that make up the Thrust/Trend Model (T/TM). Now it is time to show you how those components generate the T/TM timing signals and how you can apply the T/TM to your analysis. If you haven't read my article on the Trend Model (Part I) and the Thrust components, the Price Momentum Oscillator (PMO)/Percent Buy Index (PBI), I highly recommend you read Part II and review them before reading this article.
As I explained in my first two articles, the T/TM timing signals are defined using two primary components, Thrust and Intermediate-Term/Long-Term Trend Models. The idea behind this timing model is to combine momentum/internal strength signals and price trend signals. Thrust defines momentum/internal strength. The only signal that the T/TM uses from Thrust are BUY signals. So we use Thrust to get us into the market at bottoms. The Trend Model component confirms Thrust BUY signals and creates the Neutral and SELL signals for the T/TM. The idea behind including price trend in the T/TM is to define market tops.
The best way to learn how T/TM signals are generated is to start when we are trying to find market bottoms. How does the T/TM generate its BUY signals?
Thrust is in charge of determining the BUY signals for the T/TM. When Thrust (PMO & PBI) is on a BUY signal (both PMO/PBI have positive crossovers), the T/TM gets a BUY signal. However, that BUY signal is based strictly on momentum and doesn't take price trend into account. Therefore, we want to "confirm" the signal by using an Intermediate-Term Trend Model (ITTM). When the ITTM triggers a BUY signal while Thrust is on a BUY signal, it is "confirmed". At this point, the T/TM relies on price trend exclusively. The BUY signal on the Thrust component basically become moot once the ITTM confirms the T/TM BUY signal. Using Thrust first, we can typically (ideally) get in on market bottoms earlier because momentum is generally the first to change at market bottoms.
If Thrust loses its BUY signal (one or both of the PBI/PMO are NOT on a BUY signal) BEFORE the ITTM can confirm the signal with its own BUY signal, then the signal moves to the previous ITTM Neutral or SELL signal. Remember that an ITTM Neutral signal is generated when the 20-EMA crosses below the 50-EMA while the 50-EMA is above the 200-EMA (implies a long-term bull market is in effect). The SELL signal is generated if the 50-EMA is below the 200-EMA (implies a long-term bear market environment) at the time of the negative crossover.
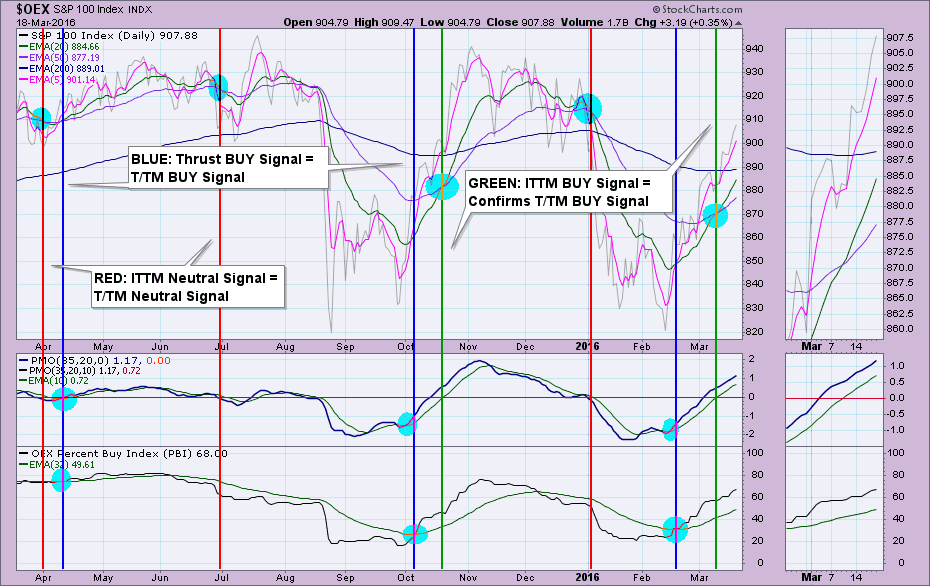
If the ITTM confirms the Thrust BUY signal, Thrust is no longer a part of the equation. The ITTM is now in charge of the next signal which would be a Neutral or SELL signal. Once an ITTM Neutral or SELL signal is established, we go back to the beginning and wait for a Thrust BUY signal to determine the T/TM signal. In the chart below, notice on the first blue line, Thrust and ITTM went on BUY signals nearly simultaneously. The T/TM is far from perfect, but in general, Thrust will get you back in before the ITTM generates a BUY signal. The ITTM will keep you in the market even if Thrust loses its BUY signal.
To apply the T/TM to your own analysis, you can look at the T/TM charts, found in the free DecisionPoint Market Indicators ChartPack. In that ChartPack you'll find T/TM charts not only for select indexes, but also for the major sectors covered in our DecisionPoint Market/Sector Summary. You can see that this model, using a Thrust component, will generally give you a signal to enter the market earlier than using the ITTM on its own. As with all of the DecisionPoint timing models and accompanying signals, I would never take these signals at face value. A review of the chart is a must. The beauty of using a Thrust component is that you can combine two very powerful technical analysis timing models to create a model (T/TM) that not only takes into account price trends (ITTM), but also uses a momentum/internal strength tool (Thrust), which makes the T/TM unique.
Come check out the DecisionPoint Report with Erin Heim on Wednesdays and Fridays at 7:00p EST, a fast-paced 30-minute review of the current markets mid-week and week-end. The archives and registration links are on the Homepage under “What’s New”.
Technical Analysis is a windsock, not a crystal ball.
Happy Charting!
- Erin
