 I received an email from a reader "thanking" me for a lucrative trade that he based off of the Thrust/Trend Model. In actuality, it turned out he used the Percent Buy Index (PBI) negative crossover not the Thrust/Trend Model per se (see the series of articles on the T/TM here). While reviewing the PBI charts, I noticed the simplicity and accuracy when the market becomes more volatile.
I decided I would share a few of these charts so that you can evaluate it more closely. But first, let me give you the short version of how the PBI is calculated. It is actually an extension of the Price Momentum Model (PMM). The PBI is simply the percentage of stocks within the specified index/sector that are on PMM BUY signals. The PMM typically has fewer crossovers than the Price Momentum Oscillator (PMO), but not all the time. Because it is based on the PMM, it can be considered more of an intermediate-term indicator than a short-term indicator like the PMO.
I have annotated the charts below to give you an idea of how the PBI crossovers can be used on their own to produce timing signals. In places where the PBI flattened out, I didn't annotate crossovers. The Nasdaq Composite is the only index we cover that has had a negative PBI crossover its signal line. However, it should be noted that all other indexes that we cover have topped in overbought territory and most are nearing negative crossovers.
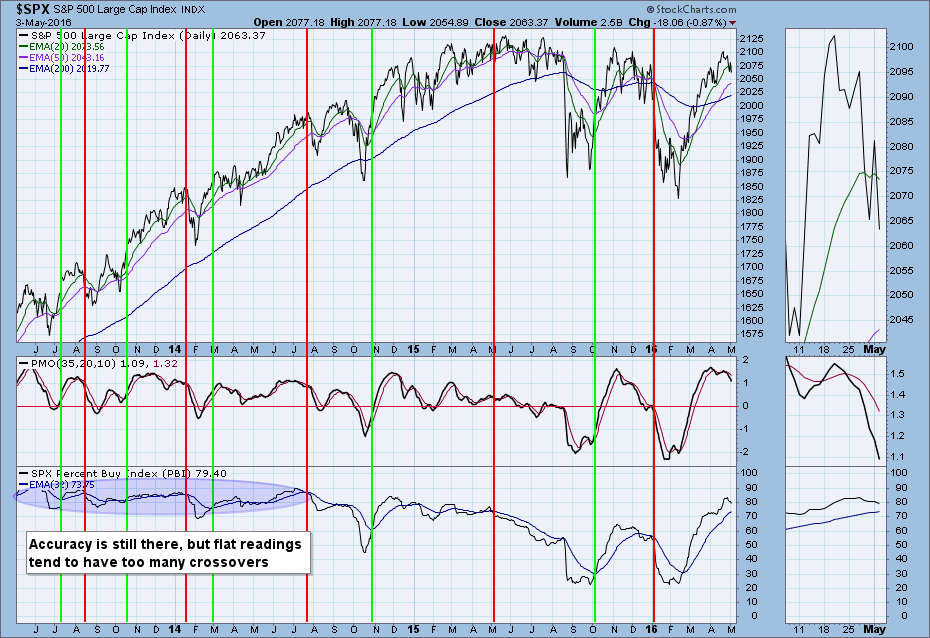
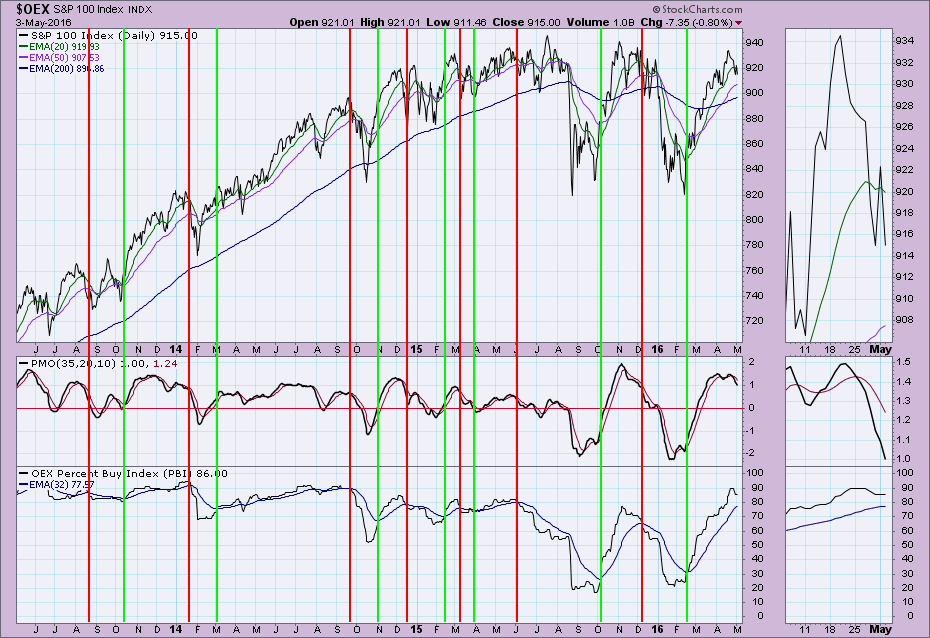
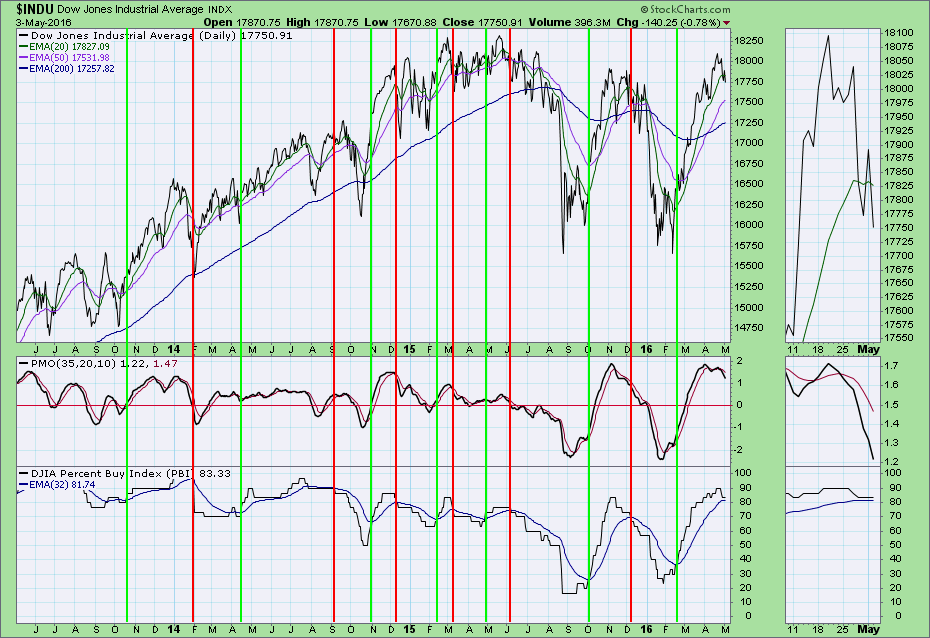
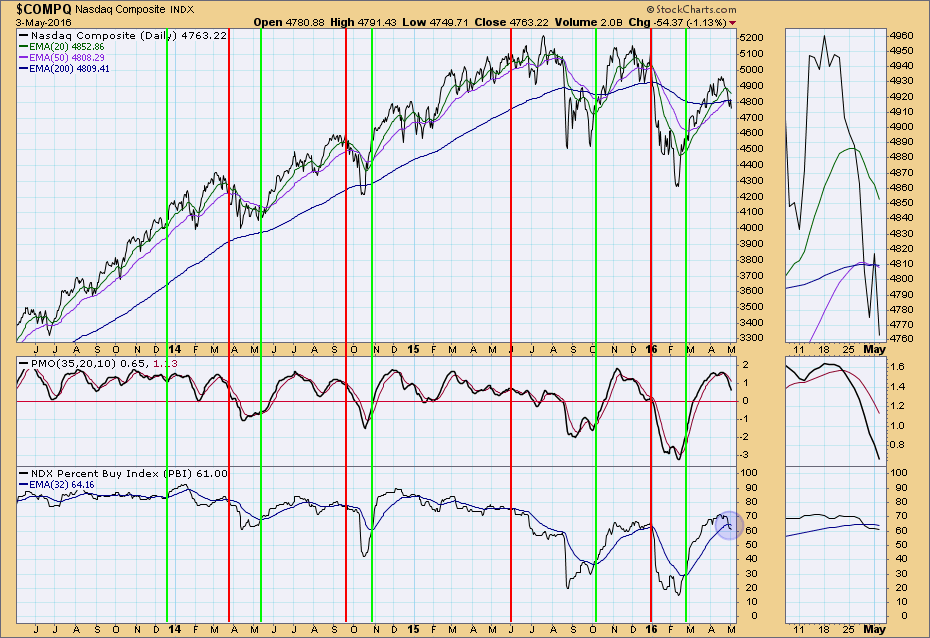
Conclusion: The PBI is an excellent tool to measure momentum in the longer term. Unlike the shorter-term PMO, it tends to have fewer crossovers. The main detractor is that it will flatten out and whipsaw can become a problem. Currently, PBI readings across the board are bearish as they are declining in overbought territory.
