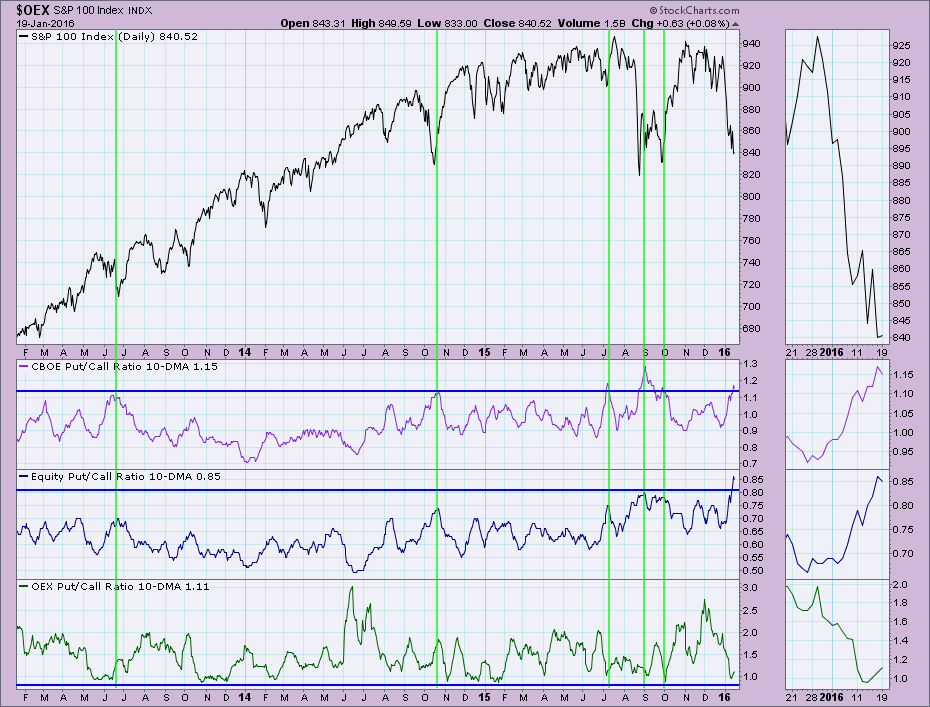
Back in January, I wrote an article about the bullishness of the Put/Call Ratio 10-DMA. As I was reviewing charts to determine what today's article would be about, I came upon this chart again. I think it would be interesting to look at the static version of the chart I posted in January and then look at today's version. Very interesting results.
Here's quick refresher on the Put/Call Ratio 10-DMAs. The Put/Call Ratio 10-DMAs will hit extremes typically at price reversals. Recall from your calculus class that when the denominator approaches infinity (bottom number gets bigger and bigger), the ratio will approach zero. So if we get far more calls than puts, the number will be less than one and get smaller as more and more calls versus puts are placed. It is typical that the OEX Put/Call Ratio 10-DMA will hit the bottom of its range, while the CBOE and Equity ratios hit the top of their ranges. In other words, CBOE and Equity ratios favor bears (increase in puts) at bullish turning points and the OEX ratios favor bulls (decrease of puts to calls) at price reversals.
Back in January, the ratios were beginning to hit extremes. It was time to expect higher prices.
What actually happened? The price reversal occurred, but unfortunately was overpowered when price topped at the end of January. However, extremes were once again reached, more so on the Equity ratio, but ultimately the market followed through. Right now, we need to see these ratios hit extremes. They are making their way to that end, but aren't there yet. We should expect more downside price action until we see these indicators reach the top and bottom of their ranges.
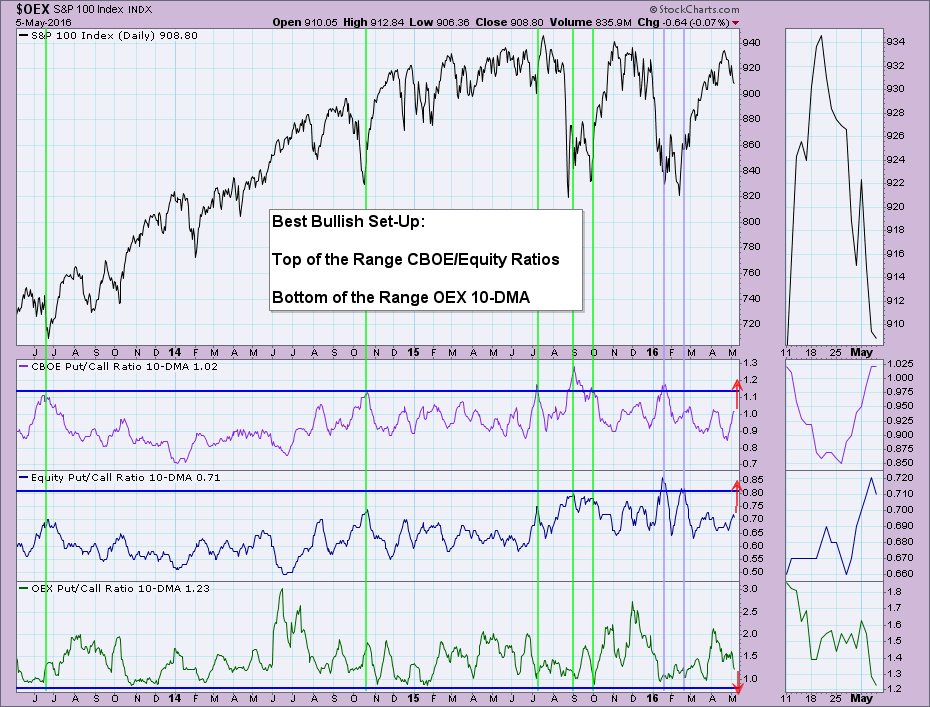
Conclusion: Historically this indicator has managed to help us find price tops and bottoms. In order to reach the best bullish set-up, we need to see CBOE/Equities get more bearish with a preponderance of puts and the OEX ratio get more bullish with an increase in calls.
Come check out the DecisionPoint Report with Erin Heim on Wednesdays and Fridays at 7:00p EST, a fast-paced 30-minute review of the current markets mid-week and week-end. The archives and registration links are on the Homepage under “What’s New”.
Technical Analysis is a windsock, not a crystal ball.
Happy Charting!
- Erin
