 Today's rally was impressive after three days of consolidation, but indicators suggest it won't last. Below I've annotated ultra-short-term and short-term indicator charts for the S&P 500. See if you agree with my conclusion.
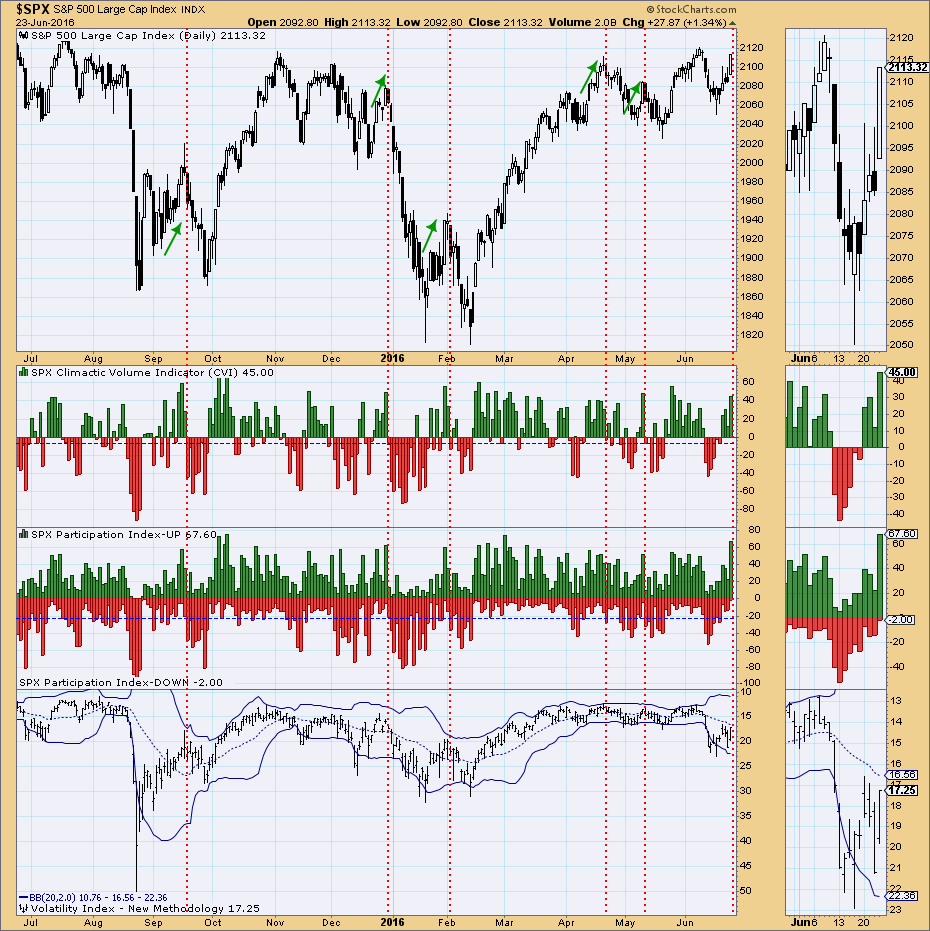
Reading ultra-short-term indicator charts can be tricky. First, the "ultra-short-term" timeframe is measured in hours to days. Whenever we get climactic spikes in the Climactic Volume Indicator (CVI) or Participation Index, they need to be read as either an initiation or exhaustion climax. My rule of thumb is to first determine what the current short-term trend is. I've annotated the uptrends and positive climactic readings that indicated a buying exhaustion on the chart below.
Currently we are in an uptrend based on the last significant market bottom from last week. Therefore, if we see high positive readings, it is likely a sign of a buying exhaustion. Similarly, if we saw climactic negative readings right now, it would be read as a selling initiation. With very high positive readings on the CVI and Participation Index - UP, I'd look for a price top in the coming day(s).
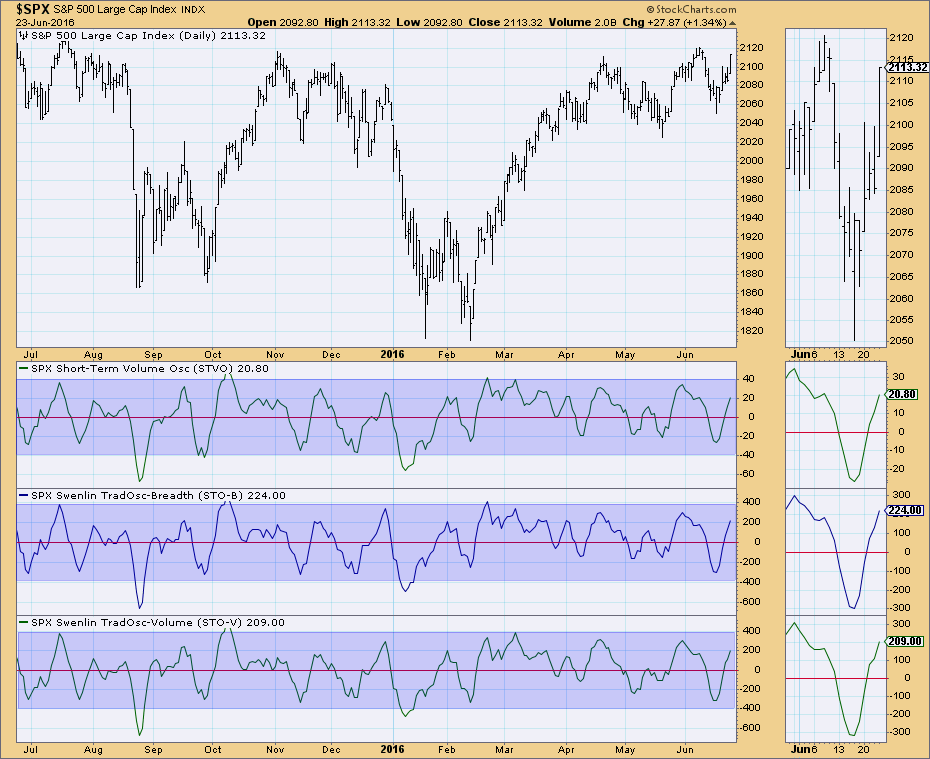
The short-term indicator chart is suggesting a buying exhaustion nearing as well. Readings have now pushed up to the top of the range and are now ready to support a decline without getting oversold too quickly.
 Conclusion: Given the climactic positive spikes on ultra-short-term indicators, as well as top of the range short-term indicators, I would expect to see a near-term decline in the next day or two. Tomorrow during my free webinar, I will be discussing these indicators and more importantly looking at intermediate-term indicators and weekly charts to see whether this could be a catalyst for a larger decline or correction.
Come check out the DecisionPoint Report with Erin Heim on Wednesdays and Fridays at 7:00p EST, a fast-paced 30-minute review of the current markets mid-week and week-end. The archives and registration links are on the Homepage under “What’s New”.
Technical Analysis is a windsock, not a crystal ball.
Happy Charting!
- Erin
