
I loved ChartCon 2016 for many reasons, chief among them was education--the education of you and me. Our education is inevitable when you can network with or watch John Murphy, Martin Pring, Greg Morris, Arthur Hill...and so on! Greg Schnell is another "tech titan" who presented at ChartCon 2016. He showed me one very uncomplicated concept. When I began applying this simple technique to my daily charts, I was honestly astounded that I hadn't figured it out myself. (Maybe I should read Greg more often!)
What is the magnificent indicator he showed us? An unassuming horizontal line in the SCTR window pane. That's it. Keep it simple, right? He explained that by adding a horizontal line at about 75, you could see very clearly the internal strength and weakness of price based on the SCTR's location above or below 75. What I noticed was that when I combined that concept with the Price Momentum Oscillator (PMO) crossovers and signals, they were a match made in heaven. Time to add a screen to my current PMO scans.
The TLT chart exemplifies this beautiful marriage. I've highlighted in green the times that readings hovered over the 75 line. Additionally, I've used blue vertical lines to accentuate PMO crossover signals. It is absolutely fascinating how the PMO crossover signals are successfully confirmed by the SCTR or vice versa! A negative PMO crossover in July confirmed the SCTR's descent below 75. Right now, the SCTR has twice run up to and failed to cross the 75 line. However, we have just gotten a new PMO BUY signal at the bottom of its near-term range. These are generally the most profitable signals (ones that arrive at the top or bottom of the normal range). Having twice failed to overcome 75, a cross by the SCTR into bullish territory will confirm the PMO BUY signal.
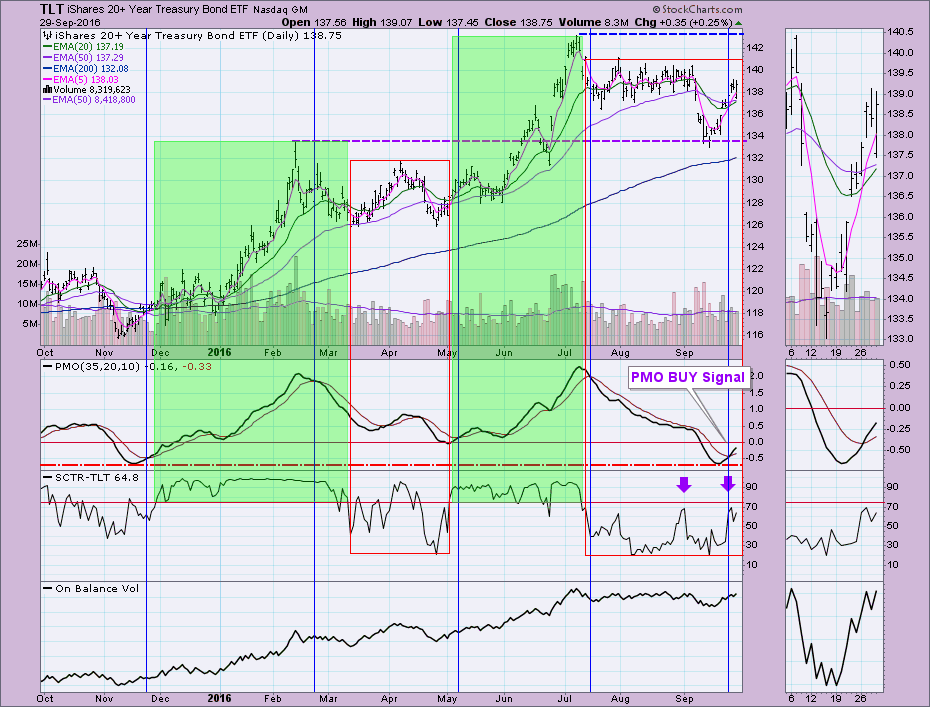
Conclusion: I haven't had the opportunity to add the "75" line to all of my daily charts, but I plan to. This chart shows how profitable using the combined PMO and SCTR "crossovers" can be. Based on what the PMO and SCTR are suggesting on TLT, we need to watch for a SCTR "crossover" above 75 to confirm the new PMO BUY signal. This would imply a move to test all-time highs or at a minimum get price above strong resistance at 141.
**To add a horizontal line to your indicator window, use the advanced options just right of the indicator. There is an "overlay" drop-down menu. Choose "Horizontal Line" and type in "75:r" to tell it to put a red line at 75. Hit update and it should be there.
The NEW DecisionPoint LIVE public ChartList has launched! Click on the link and you'll find webinar charts annotated just before the program. Additional "chart spotlights" will be included at the top of the list. Be sure and bookmark it!
Come check out the DecisionPoint Report with Erin Heim on Wednesdays and Fridays at 7:00p EST, a fast-paced 30-minute review of the current markets mid-week and week-end. The archives and registration links are on the Homepage under “Webinars”.
Technical Analysis is a windsock, not a crystal ball.
Happy Charting!
- Erin
