 If today's blog title is enticing, then you definitely should consider signing up for ChartCon 2016 - September 23/24. This is the title of my presentation. Obviously, I don't have the time or space to write about this in detail, but I did want to give you a taste of what you can expect to learn from the DecisionPoint presentation.
The whole "point" of using DecisionPoint analysis is to keep it simple by looking at two main ingredients: Trend and Condition. Consequently, our timing models use both of these ingredients in three timeframes. I'm sure many of you have seen our DecisionPoint Scoreboards in the DP Chart Gallery or in my blogs or webinars (sample below). We've created Scoreboards for the four major indexes: SPX, OEX, NDX and INDU. After watching my presentation, you'll be able to create the same Scoreboards for your investments.
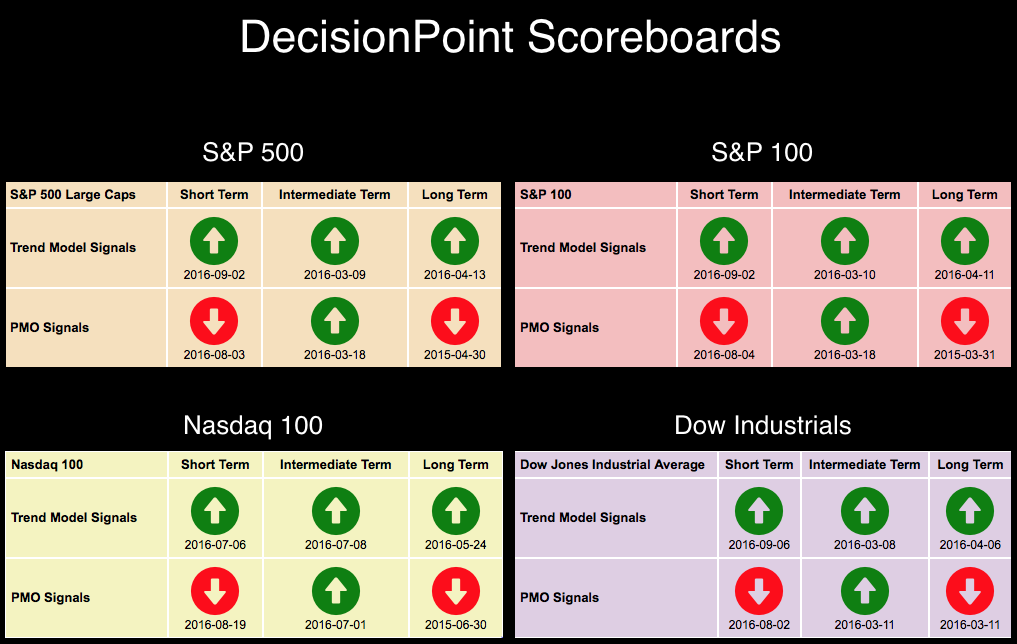
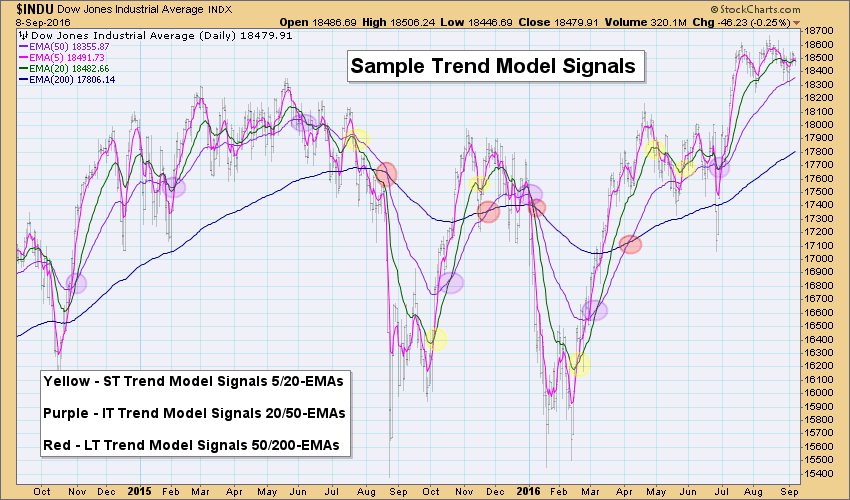
The DecisionPoint Trend Models are what determine the trend in all three timeframes (the top row of Scoreboard). Fortunately, you'll find all three signals on the daily chart. The Trend Models are based on four moving averages, 5/20/50/200-EMAs. The determination of the signal is based on which EMAs you use. The Short-Term Trend Model uses 5/20-EMA crossovers in relation to the 50-EMA. The Intermediate-Term Trend Model uses 20/50-EMA crossovers in relation to the 200-EMA. The Long-Term Trend Model signals are based on 50/200-EMA crossovers. I'll explain them in more detail during my presentation!
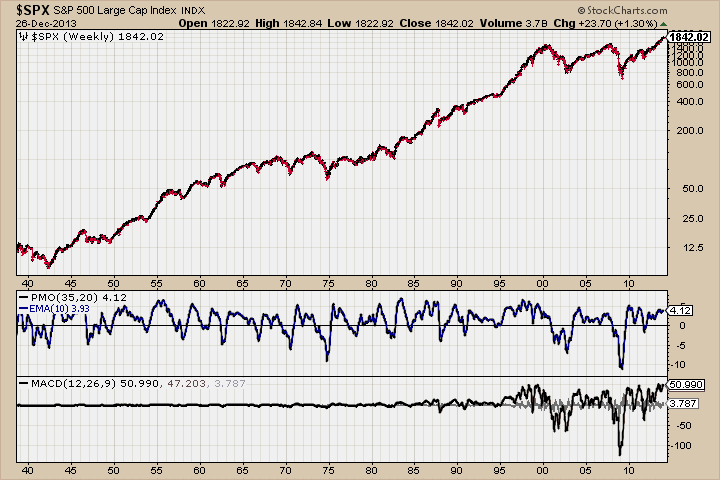
 The DecisionPoint Price Momentum Oscillator (PMO) is our cornerstone indicator. Developed by Carl Swenlin in the 1990's, this indicator is every bit as powerful as the MACD, only better in our opinion. Why? Mainly because it is a ratio calculation so it can be used for historical comparisons and relative strength analysis. Additionally, it is calculated differently on daily, weekly and monthly charts and we've found it is very responsive. In the chart below you can see the comparison between the MACD and the PMO:
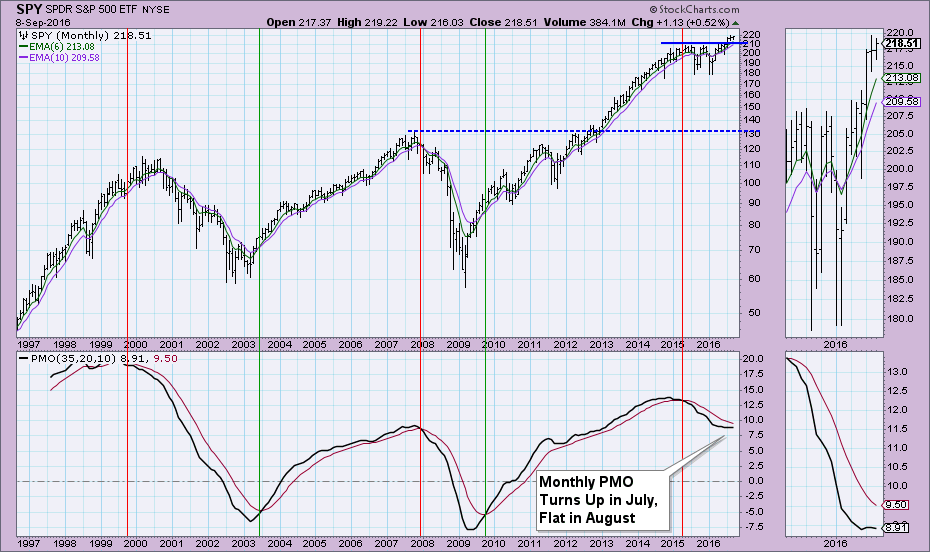
You'll find the Short-Term PMO signal on the daily chart, the Intermediate-Term PMO signal on the weekly chart and the Long-Term PMO on the monthly chart. The signals are generated by crossovers their signal lines. Below is the monthly chart for the SPY. You'll note there have been very few PMO signals over the years, but they have been right on. Currently we are on a SELL signal that occurred in early 2015. There is the possibility that the volatile year that has followed that signal could be all the 'bear market' we'll see. However, the now hesitant PMO is suggesting that there may be more downside to absorb.
There are many tips and techniques I will show you, including: Scans using the Trend Models and PMO, How to create a DP Scoreboard and its uses, How to use market indicators to determine bias in all three timeframes, among many more! If you haven't signed up or at least explored what ChartCon 2016 is about, be sure to soon before it's too late!
The NEW DecisionPoint LIVE public ChartList has launched! Click on the link and you'll find webinar charts annotated just before the program. Additional "chart spotlights" will be included at the top of the list. Be sure and bookmark it!
Come check out the DecisionPoint Report with Erin Heim on Wednesdays and Fridays at 7:00p EST, a fast-paced 30-minute review of the current markets mid-week and week-end. The archives and registration links are on the Homepage under “Webinars”.
Technical Analysis is a windsock, not a crystal ball.
Happy Charting!
- Erin
