There is a negative divergence between prices and total assets in stock mutual funds. While prices have moved to all-time highs, the value of total assets in those mutual funds has actually fallen. How can this happen?
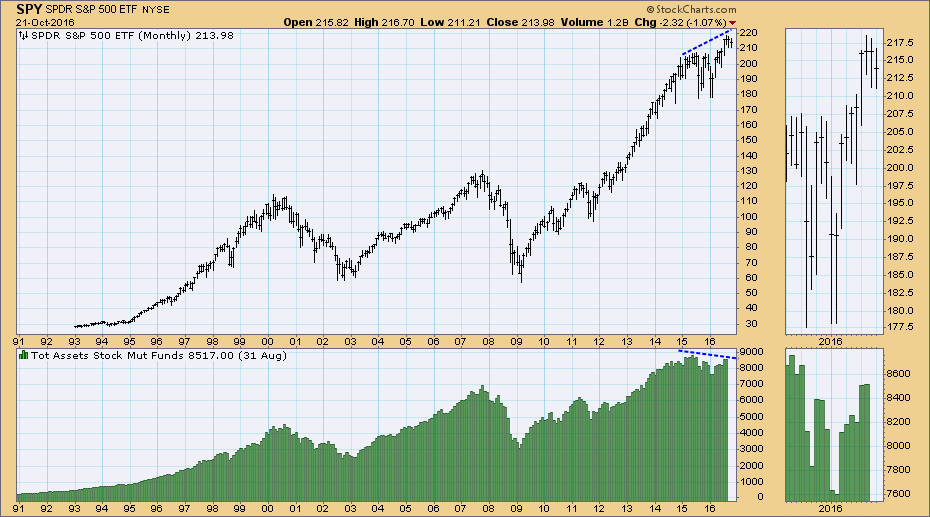 Source: ICI.org
SPY components are exclusively large-cap stocks, while total assets in stock mutual funds presumably consist of a wide range of large- to small-cap stocks. The shrinking value of those assets can be caused by falling prices of the smaller-cap stocks.
Another cause is that assets are being removed from those funds. As we can see on the bottom panel of the chart below this has been the case. While prices have moved higher, stock funds have experienced negative cash flow for several months.
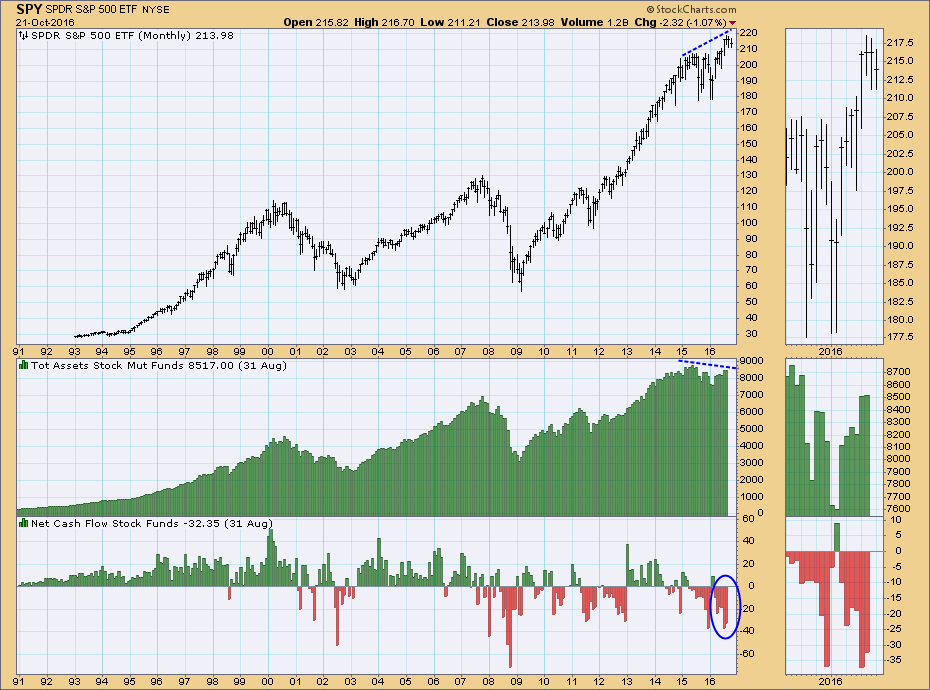
Source: ICI.org
While it is not directly related to cash flow, the Mutual Fund Percent Cash reading has been useful in anticipating tops in the past. Below we can see that low readings in 2000 and 2007 coincided with important market tops. Unfortunately, this indicator seems to be broken, because readings have been persistently low since 2009. Perhaps improved technology has made cash management easier than in the past, but I don't really know. For what it's worth, the most recent reading is the lowest in 25 years.
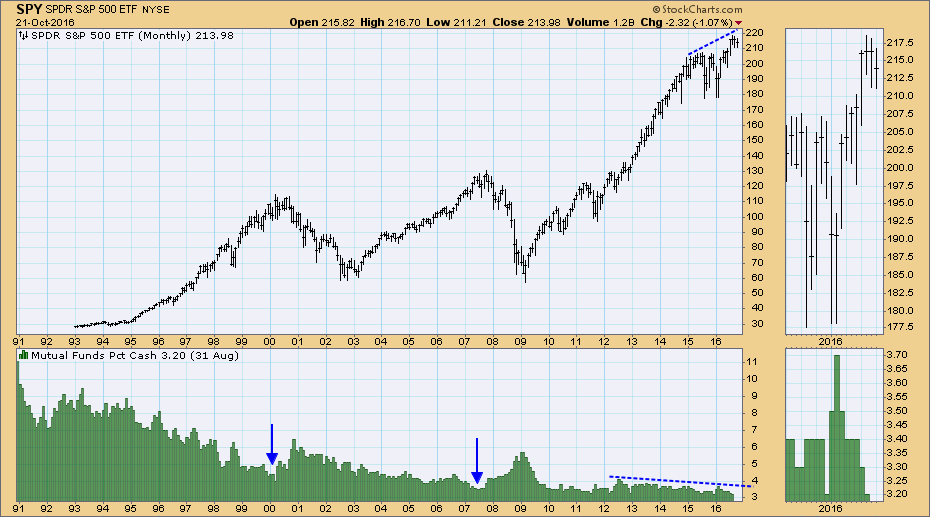
Source: ICI.org
CONCLUSION: Mutual fund statistics can help us evaluate the underlying strength or weakness of the market. Currently, total assets indicate that there could be weakness in smaller-cap stocks. More obvious, it is clear that money has been flowing out of stock mutual funds for over a year. None of these facts guarantee that prices will fall, but they exert a negative influence on the market.
The NEW DecisionPoint LIVE public ChartList has launched! Click on the link and you'll find webinar charts annotated just before the program. Additional "chart spotlights" will be included at the top of the list. Be sure and bookmark it!
Come check out the DecisionPoint Report with Erin Heim on Wednesdays and Fridays at 7:00p EST, a fast-paced 30-minute review of the current markets mid-week and week-end. The archives and registration links are on the Homepage under “Webinars”.
Technical Analysis is a windsock, not a crystal ball.
Happy Charting!
- Carl
