A PMO bottom is one of the first signs we get that a new up trend may be at hand, and action in the very short-term may be considered. It would be convenient if every PMO bottom was a sure thing, but, of course, that is not the case. The series of PMO bottoms formed over the last two weeks is a good example of how some signals are throwaways.
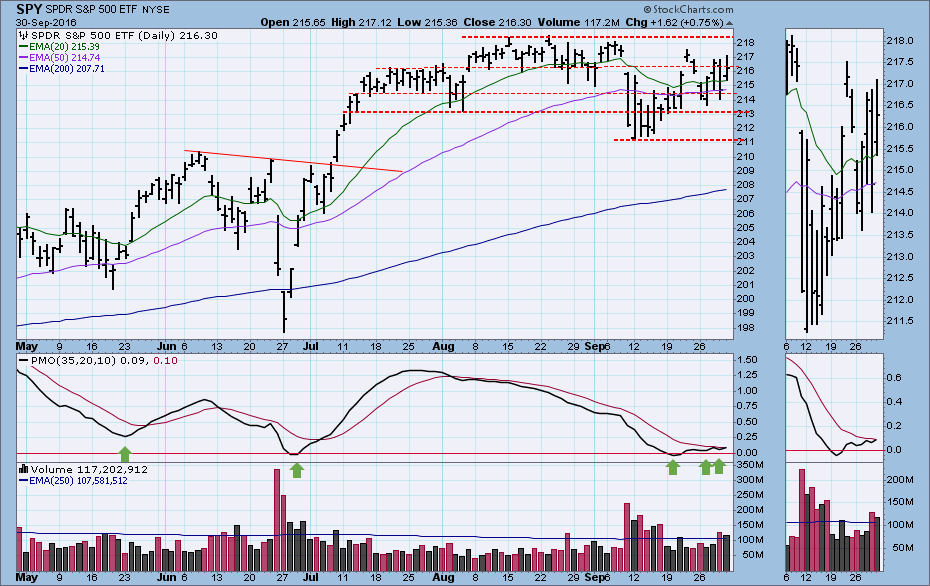
The most reliable PMO bottoms are usually found at very oversold levels. For SPY that PMO level is around -2.0, which is a level normally reached on modest corrections during a bull market. As we can see on the chart above, none of the three prominent PMO bottoms got much lower than zero, but in a bull market such configurations can be considered for action.
The bottoms in May and June were good examples of the kind of PMO bottoms we like to see. After each bottom the PMO moved smartly and smoothly upward, crossing the signal line in a week or less. Next, the first PMO bottom in September looked good a first, but the PMO topped before it crossed up through the signal line. The PMO has since bottomed twice more, and it still hasn't executed an upside crossover. Nearly two weeks have elapsed since the first bottom. Instead of setting up a juicy target, the PMO is flat and sluggish.
It is still possible for price to catch fire and set the PMO on a more energetic course upward, but price is currently struggling with the overhead resistance of all-time highs. There is also the rising wedge pattern on the chart below, a pattern we normally expect to resolve downward.
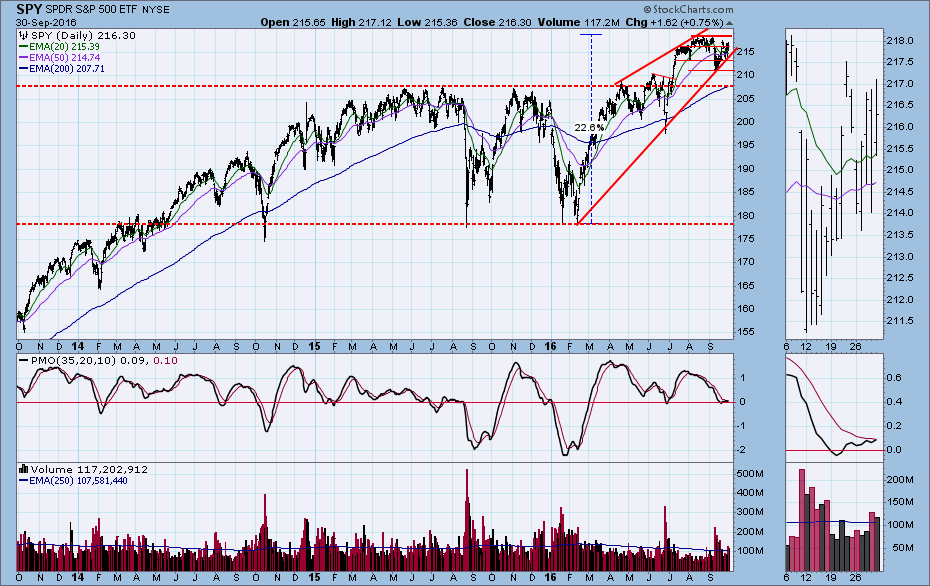 This chart also presents a better representation of the normal PMO range, although this range has a bull market bias with many PMO bottoms forming above or near the zero line.
CONCLUSION: PMO bottoms can be an early sign that a new rising trend may be starting, but each one must be examined and evaluated in context. The SPY PMO made a promising bottom about two weeks ago, but in the last two weeks the PMO has been erratic and sluggish, a reflection of the trouble price is having with overhead resistance. A more vigorous price advance may develop, but the mechanics of the rising wedge create the likelihood of a downside resolution of price.
Technical analysis is a windsock, not a crystal ball.
