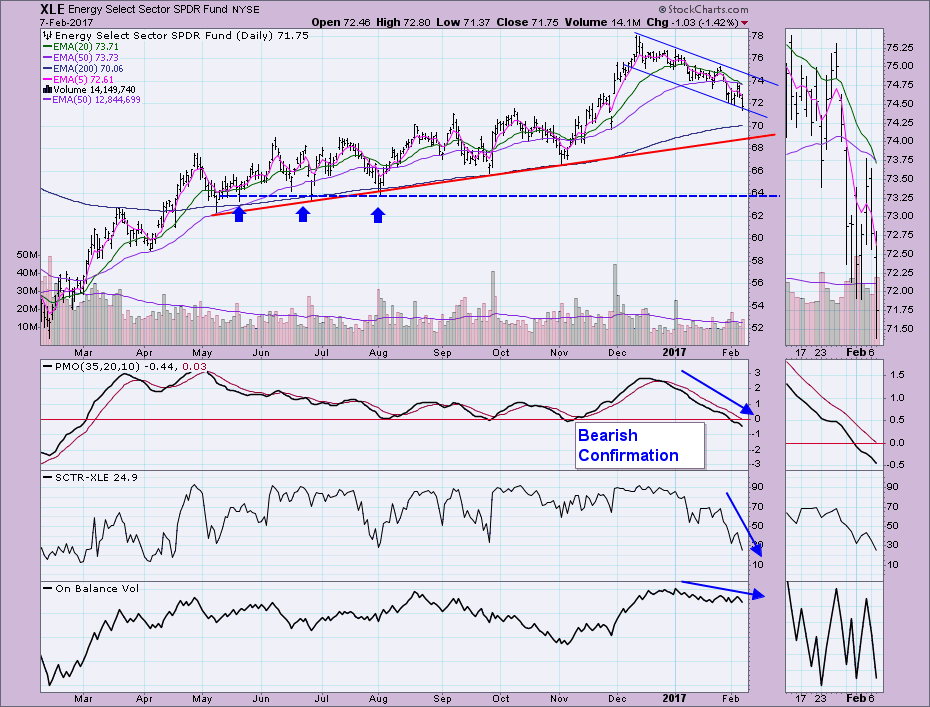
 Both the Energy SPDR (XLE) and its counterpart, the equally-weighted Energy ETF (RYE) triggered new Intermediate-Term Trend Model Neutral signals when the 20-EMAs crossed below the 50-EMAs while the 50-EMA was below the 200-EMA. We consider a stock, index, ETF, etc. to be in a "bull market" as long as the 50-EMA is above the 200-EMA. This is why we don't move to a SELL signal unless the 50-EMA is below the 200-EMA.
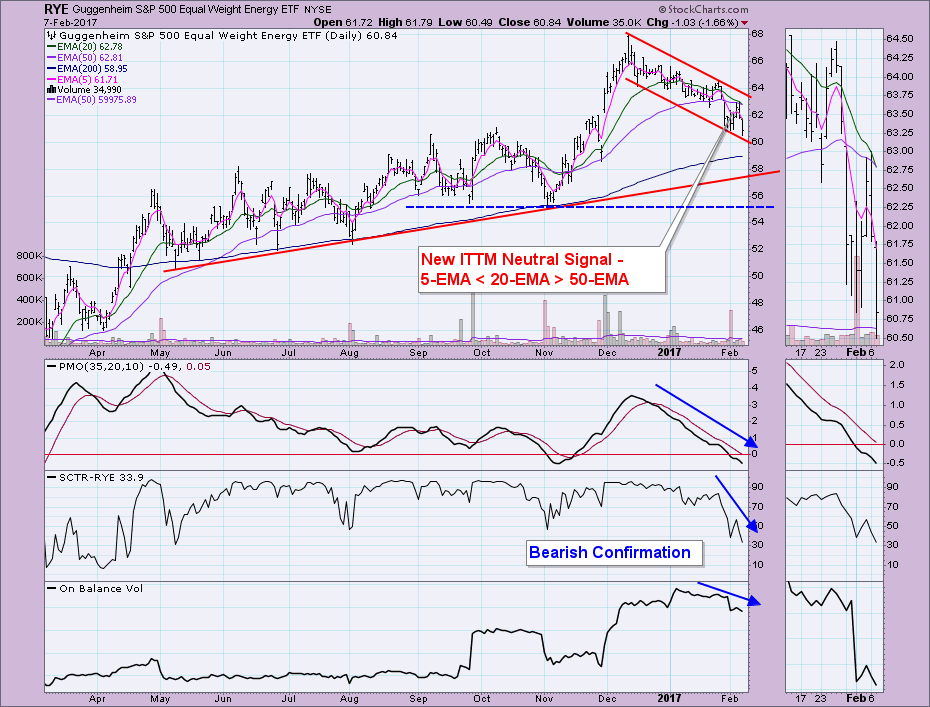
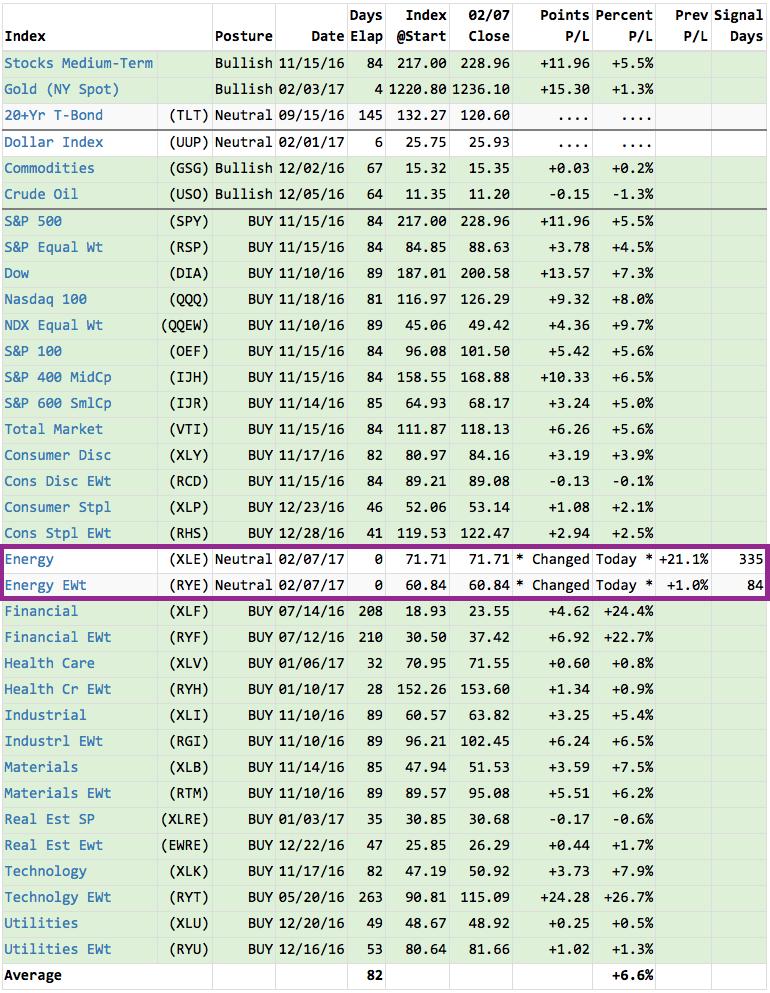
Below is an excerpt from today's DecisionPoint Reports blog, Market/Sector Summary. This particular table tells us what Intermediate-Term Trend Model signals the sectors, major indexes and ETFs are on. Currently the table is quite bullish with the majority on BUY signals. These lost BUY signals are the first sign of deterioration.
Looking at both charts, it isn't a surprise to see ITTM Neutral signals. They've both been in declining trend channels and today they are pressing against the bottom of them. The indicators are quite bearish. The ITTM Neutral signals are not the only problems here. All three indicators are all in decline, confirming the declining trend.
For XLE, the rising bottoms trend line and 200-EMA have provided solid support. This time might be different given the very bearish indicators. Best case is a stop at the 200-EMA or rising bottoms trendline, but I think strongest support lies at about $64 where it comes in contact with more than one price bottom.
 In the case of RYE, the 200-EMA and rising bottoms trendline also seem to be the best near-term support. Looking at the price pattern, I would put support at $55. There are certainly support levels beyond that, but past the 200-EMA, that one makes the most sense to me.
The NEW DecisionPoint LIVE public ChartList has launched! Click on the link and you'll find webinar charts annotated just before the program. Additional "chart spotlights" will be included at the top of the list. Be sure and bookmark it!
Come check out the DecisionPoint Report with Erin Heim on Wednesdays and Fridays at 7:00p EST, a fast-paced 30-minute review of the current markets mid-week and week-end. The archives and registration links are on the Homepage under “Webinars”.
Technical Analysis is a windsock, not a crystal ball.
Happy Charting!
- Erin
