While the 200EMA (exponential moving average) smooths daily prices over a long period of time and shows us the trend within that time frame, it also acts as a moving base line of price. As we watch daily prices depart from the 200EMA, we can get a sense of how extended they are.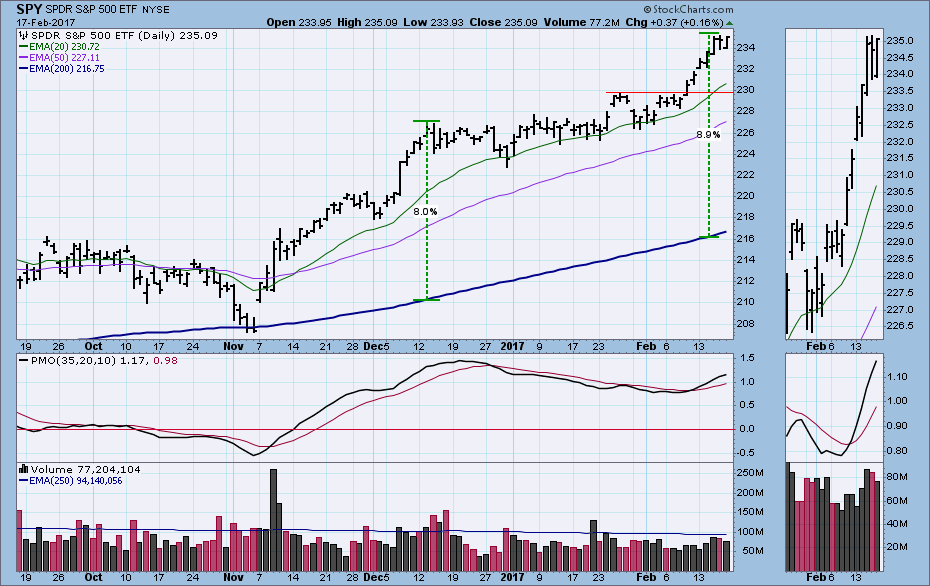
For example, in December SPY was +8% above its 200EMA. Then a six-week period of consolidation followed, during which the distance between price and 200EMA converged somewhat. Currently we can see that once again price has moved substantially (+8.9%) above the 200EMA, and it is extremely likely that price and its 200EMA will soon converge again. This can happen as the result of: (1) another consolidation, (2) a correction, or (3) a reduction of the rate at which price is climbing.
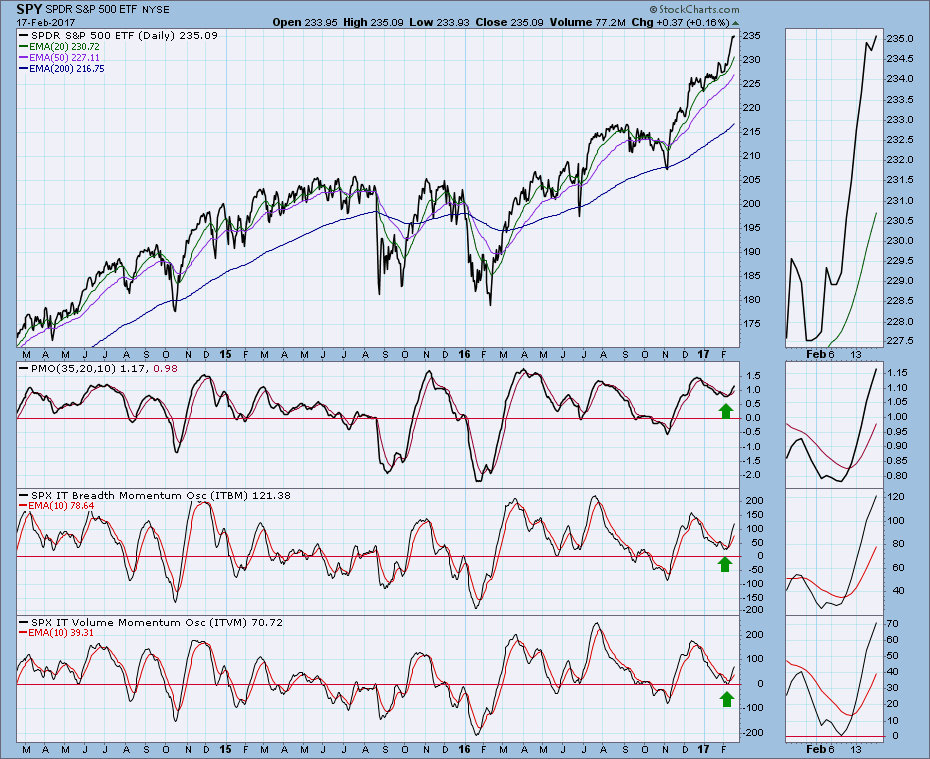
Looking at a chart of our primary intermediate-term indicators below, we can see that internally the market is modestly overbought, but there is still plenty of room to accommodate higher prices before internals become uncomfortably overbought.
Let's drop all that into a longer-term context. It has been a few months since we looked at the bull market on the weekly chart, so let's revisit. We are in a secular bull market that began at the 2009 price low, and it has advanced about +311% to date. There was a brief cyclical bear market in 2011, and in 2015/16 a consolidation that (in my opinion) substituted for a cyclical bear market. The current cyclical bull market launched off the 2016 lows, and has gained +33% so far.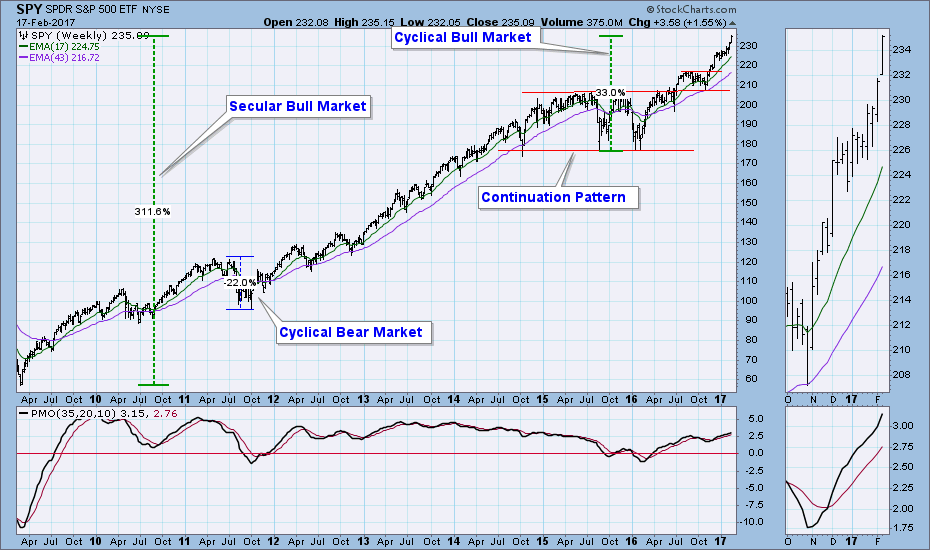 CONCLUSION: The market environment is very bullish. We are in a secular bull market that has lasted eight years so far. We are also in a new cyclical bull market that is only a year old, and we should expect it to run for another year or more. Short-term prices are really extended, and we should be expecting some kind of price activity to help digest the recent advance.
The NEW DecisionPoint LIVE public ChartList has launched! Click on the link and you'll find webinar charts annotated just before the program. Additional "chart spotlights" will be included at the top of the list. Be sure and bookmark it!
Come check out the DecisionPoint Report with Erin Heim on Wednesdays and Fridays at 7:00p EST, a fast-paced 30-minute review of the current markets mid-week and week-end. The archives and registration links are on the Homepage under “Webinars”.
Technical Analysis is a windsock, not a crystal ball.
Happy Charting!
- Carl
