 Yesterday during the DecisionPoint Report webinar I decided to run a short-term scan and run through the results with my viewers. You can find the webinar here. I promised to write a blog article with the text of the scan so that Extra members can copy and paste directly into the scanning workbench. Yesterday the scan returned seven charts. Today it returned 36 charts.
SHORT-TERM TREND MODEL--PMO RISING SCAN
[type = stock] AND [Daily SMA(20,Daily Volume) > 50000]
and [country is US]
AND[today's PMO Line(35,20,10)<today's PMO Signal(35,20,10)]
AND [today's PMO Line(35,20,10) > yesterday's PMO Line(35,20,10)]
AND [yesterday's PMO Line(35,20,10) > 2 days ago PMO Line(35,20,10)]
AND [2 days ago PMO Line(35,20,10) > 3 days ago PMO Line(35,20,10)]
AND [today's ema(50,close) > today's ema(200,close)]
AND [today's ema(5,close) X today's ema(20,close)]
The scan text is above. Let's walk through it so you know what you're asking the scan engine to actually do. I'll follow-up with a bonus. I'll include a chart that came up in the scan that looks "interesting".
The first two lines are defining the universe of stocks we want to pull from. In this case, a US stock with a 20-DMA of volume above 50,000.
The following lines for the Price Momentum Oscillator (PMO) basically define a PMO that has been rising for three days. Note that each successive day's PMO reading is listed as greater than the previous.
Next I ask that the 50-EMA is above the 200-EMA. DecisionPoint analysis considers a stock with a 50-EMA above the 200-EMA as in a "bull market". When a stock is in a "bull market" we should expect bullish outcomes over bearish ones. That's a good start to any investment.
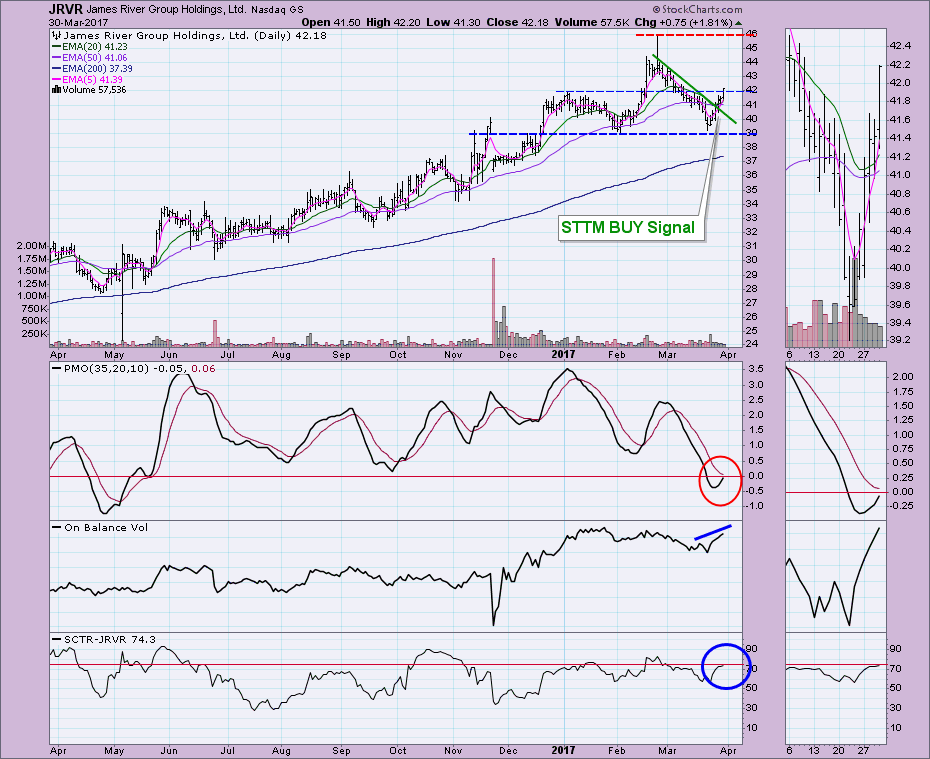
The final two lines identify stocks which have JUST triggered a new Short-Term Trend Model (STTM) BUY signal. A STTM BUY signal is triggered when the 5-EMA crosses above the 20-EMA.
So what did I find today out of the 36 candidates on the list? There were a few interesting charts. This one caught my eye. The distinct undulation of the PMO has prevented whipsaw signals. That's a good start. Next the PMO is bottoming in oversold territory. After I called up the chart for further analysis, I noticed the breakout on the chart. Price not only broke above the declining tops trend line, it also broke above horizontal resistance at the January high. The OBV is rising and the SCTR is about to cross above 75. I don't necessarily see a lot of mileage here, but if the STTM and PMO are on point, a move up to $46 would be a tidy profit.
 **This is NOT a trading recommendation, only an attention flag.
The DecisionPoint LIVE Shared ChartList has all of your favorite DecisionPoint charts annotated! Click on the link and you'll find webinar and blog chart spotlights. Be sure and bookmark it!
Technical Analysis is a windsock, not a crystal ball.
Happy Charting!
- Erin
