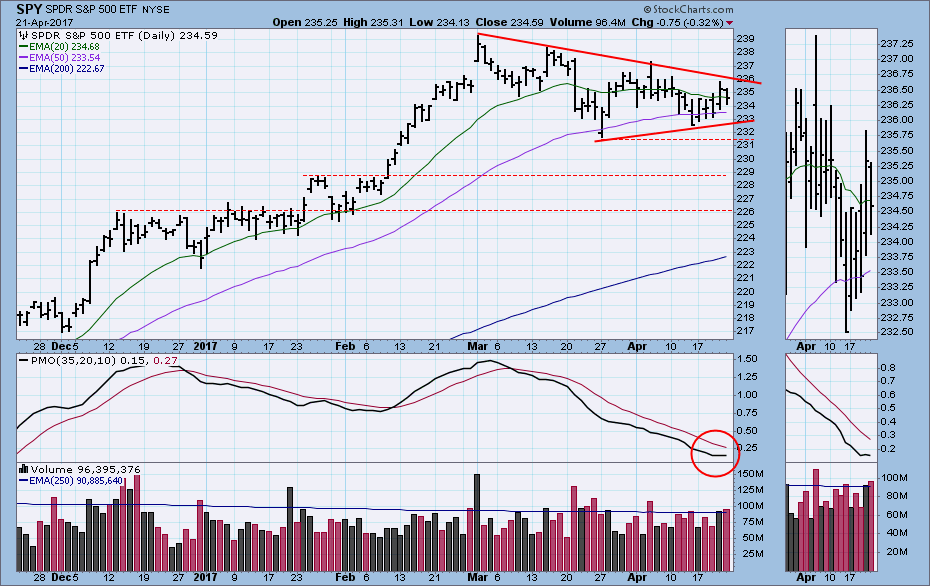
Last week I wrote, "The first necessary signal that the correction is over would be for the daily PMO (Price Momentum Oscillator) to turn up." That happened on Thursday, but there was no follow through on Friday due to, I believe, it being options expiration day, which tends to dampen volatility and keep prices steady. The slight decline caused the PMO to turn down again, but the direction is basically sideways. Let's see if a deeper analysis will clarify the situation for us.
The DecisionPoint Weekly Wrap presents an end-of-week assessment of the trend and condition of the stock market (S&P 500), the U.S. Dollar, Gold, Crude Oil, and Bonds.
STOCKS
IT Trend Model: BUY as of 11/15/2016
LT Trend Model: BUY as of 4/1/2016
The expansion of volume on Friday was due to options expiration, so I don't think it serves to emphasize the decline on that day. The PMO is indecisive. The triangle formation defines the current correction, and a breakout from that triangle will probably mark the correction's end.
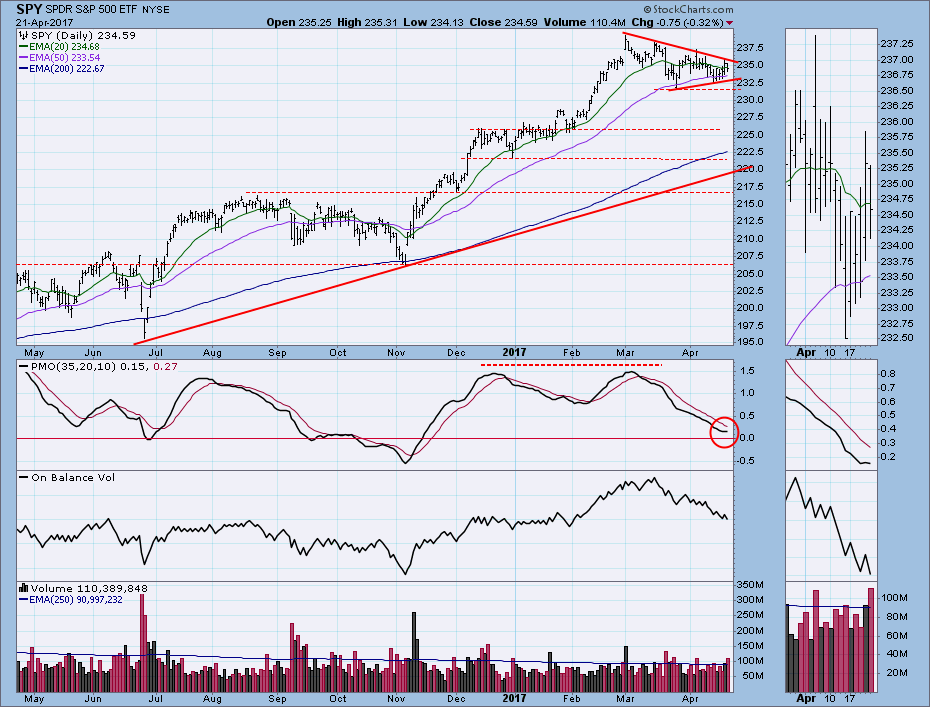
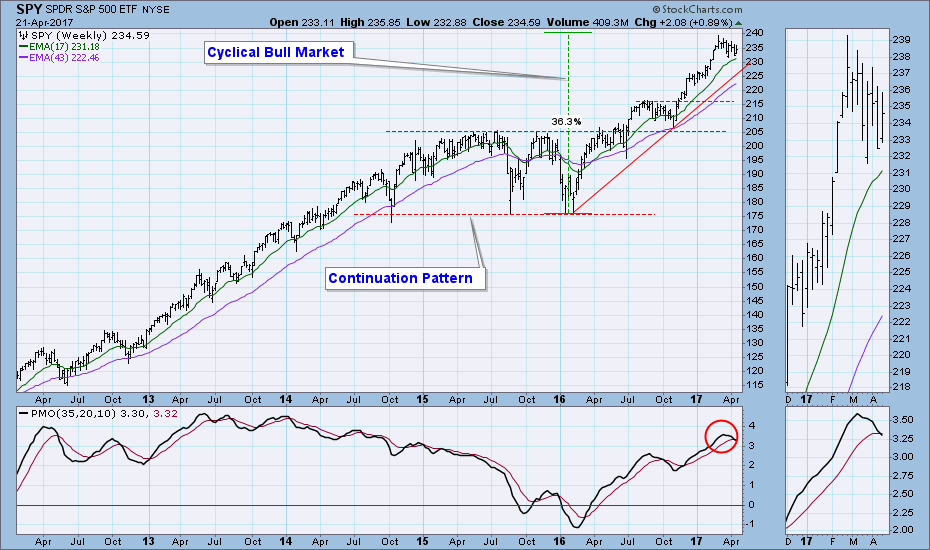
The weekly PMO has topped and dropped below its signal line. That is a SELL signal, but I'm thinking it will probably not be any more serious than the one generated in the fall of 2016 -- price can correct further before the rising trend line is encountered.
Short-Term Indicators: Internals are neutral in this time frame.
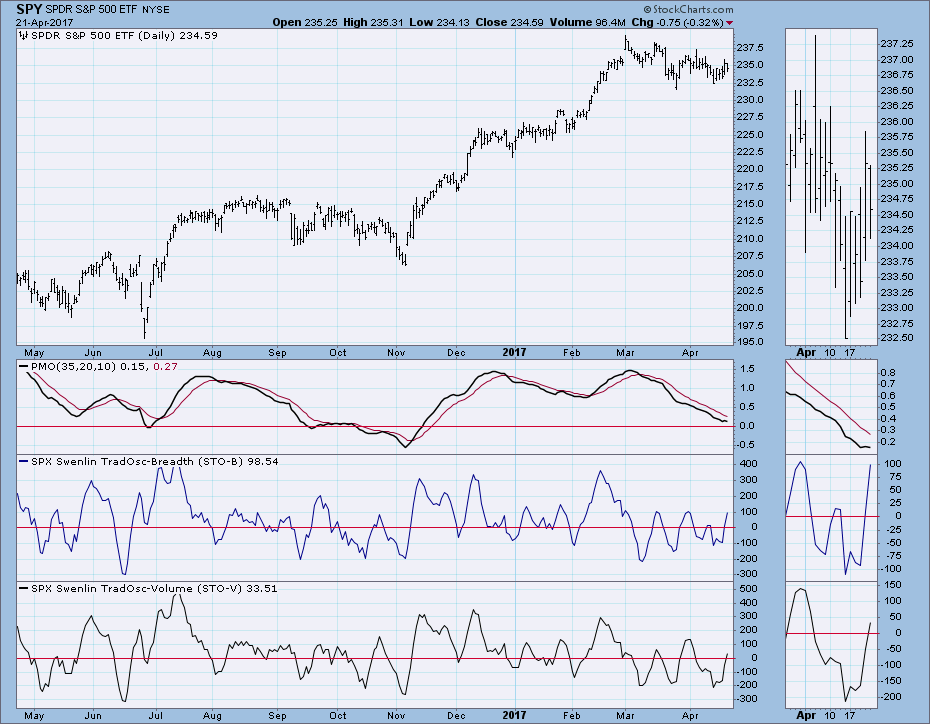
Intermediate-Term Indicators: All these indicators seem to be trying to bottom at a level that could be sufficiently oversold for a bull market.
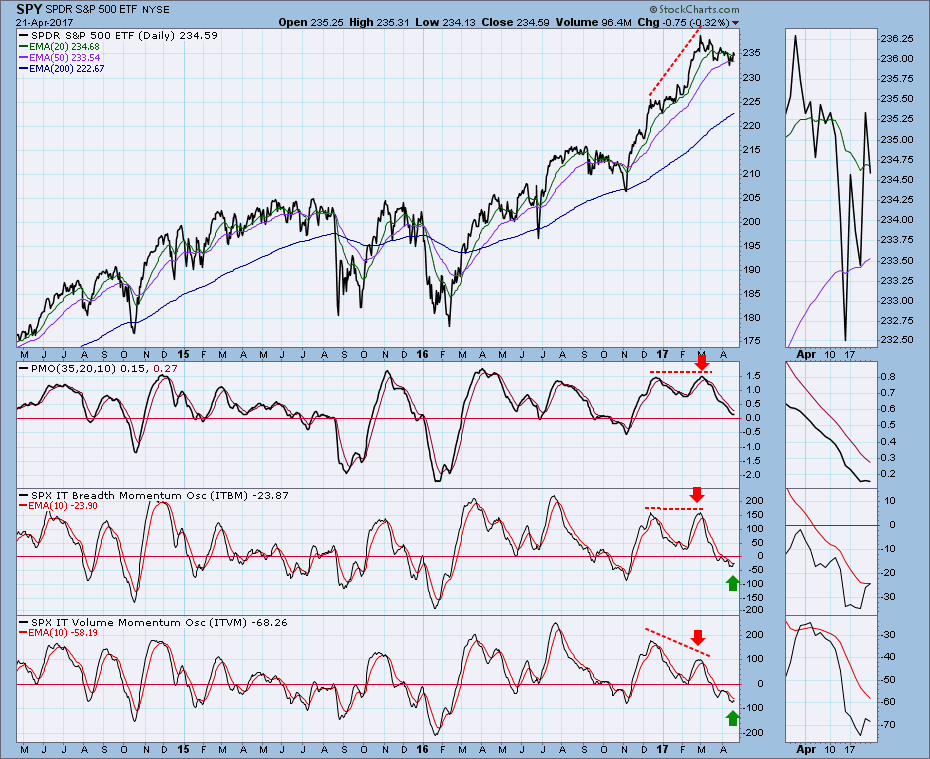
Conclusion: Is the correction over? Well, no, but it may be very soon. Objectively speaking, intermediate-term internals have declined to levels that could justify another leg up, and they are doing their best to bottom. The market has been correcting for seven weeks, which is sufficient, if not conclusive. We have IT and LT BUY signals, so my bias has to be weighted toward the bull. My posture is to look for an up move next week, and as last week, a daily PMO bottom will be the first, if not infallible, clue that the market is done correcting. If an upside breakout follows, I will believe it.
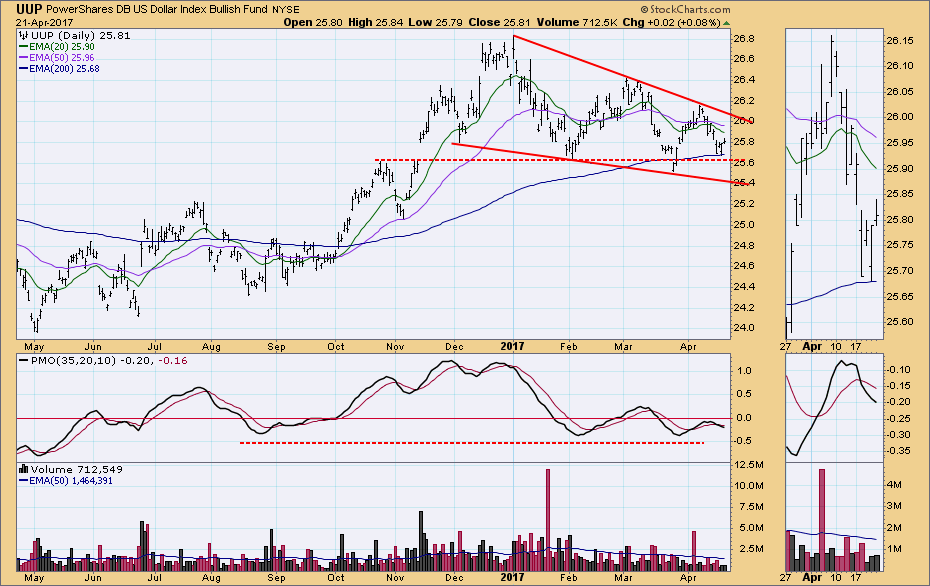
DOLLAR
IT Trend Model: NEUTRAL as of 3/21/2016
LT Trend Model: BUY as of 10/17/2016
UUP found support on the 200EMA and has begun a small bounce. The dominant feature on this chart is the falling wedge formation. Since UUP is in a bull market (50EMA is above the 200EMA), an upside breakout from the wedge is the likely resolution.
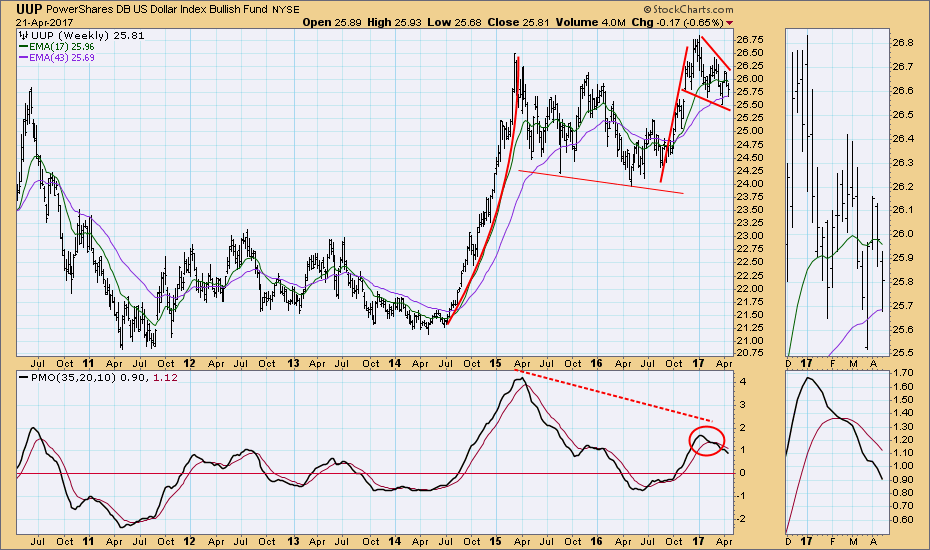
There is a bullish flag formation on the weekly chart, which has caused the PMO to decline. If the flag resolves bullishly, as expected, the PMO will rise in confirmation of the move.
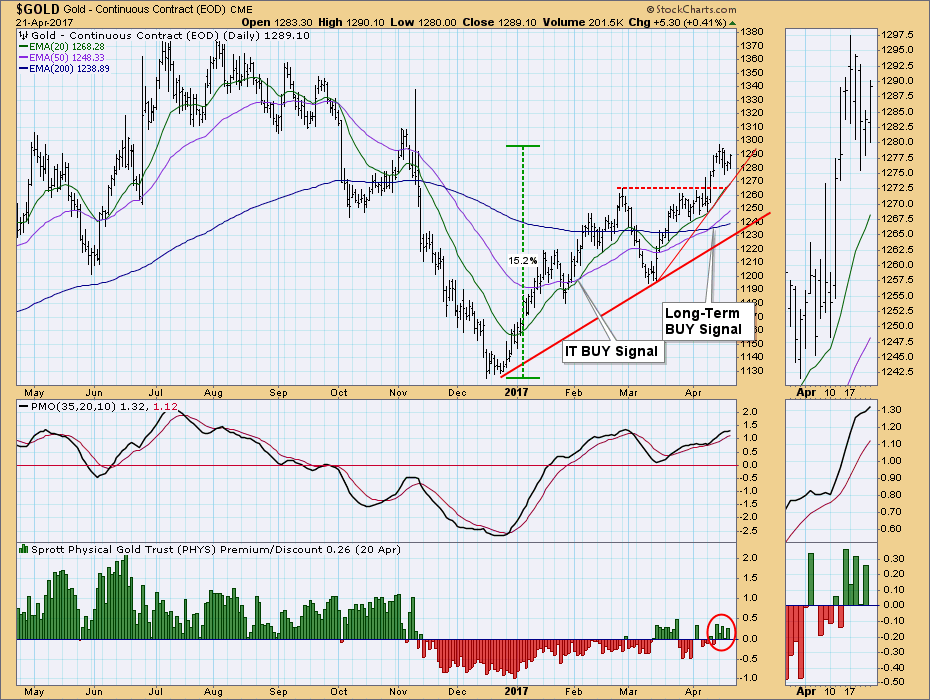
GOLD
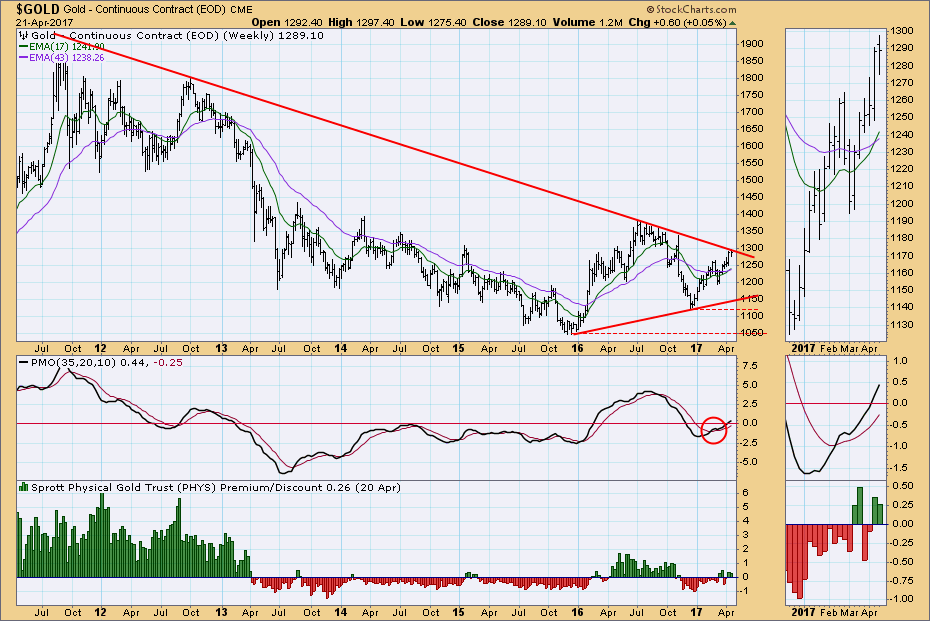
IT Trend Model: BUY as of 2/3/2016
LT Trend Model: BUY as of 4/12/2017
Gold is bullish in both the intermediate- and long-term time frames. After last week's breakout, it hit a top, then pulled back briefly this week. On Friday gold seemed to be resuming its up trend. The bottom panel shows sentiment to be slightly bullish. My primary problem with gold is that the dollar looks as if it will be making a strong up move soon, and it is unlikely that gold will be able to advance against a strong dollar.
 The weekly chart shows gold attempting to break through a long-term declining tops line drawn from the 2011 all-time high. The weekly PMO is bullish.
CRUDE OIL (USO)
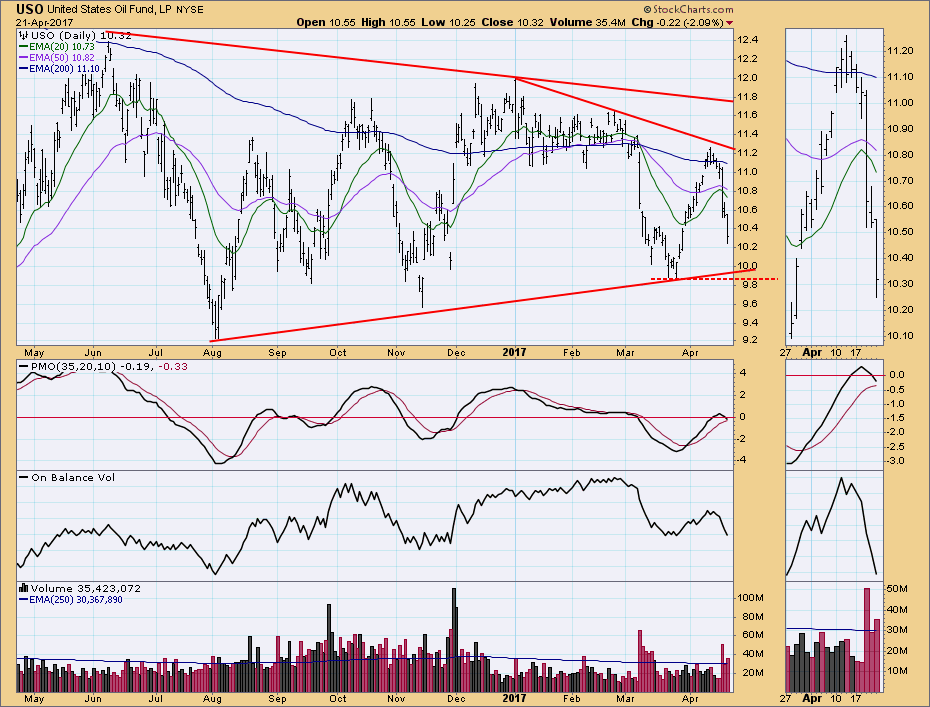
IT Trend Model: NEUTRAL as of 3/8/2017
LT Trend Model: SELL as of 3/9/2017
Last week's high fell short of the short-term declining tops line, and this week USO went into full retreat mode. There is horizontal support drawn across the March lows, but I have little confidence that it will stop the decline.
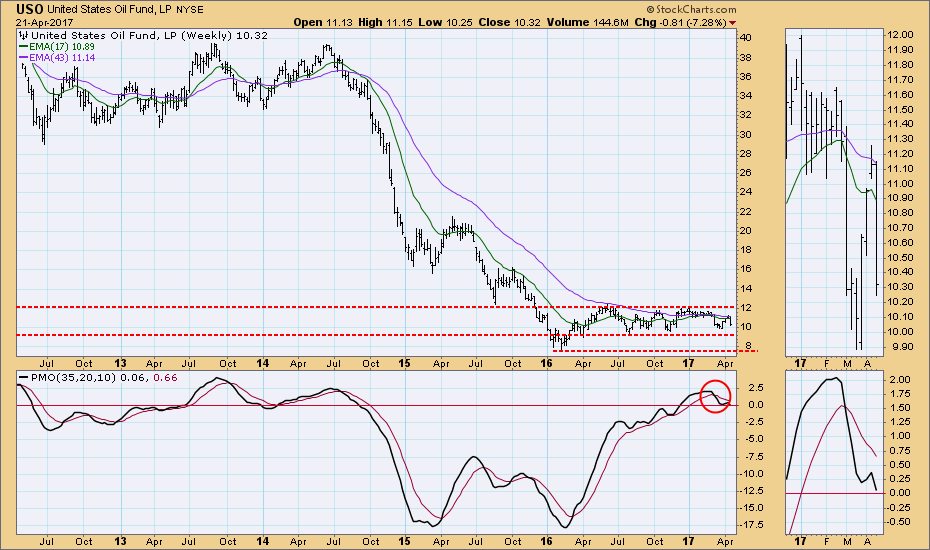
The weekly PMO has topped below its signal line, which is a particularly ominous sign. There is potential support around 9.00 at the bottom of the one-year trading range, but it is possible that the 2016 low around 7.80 could be tested.
BONDS (TLT)
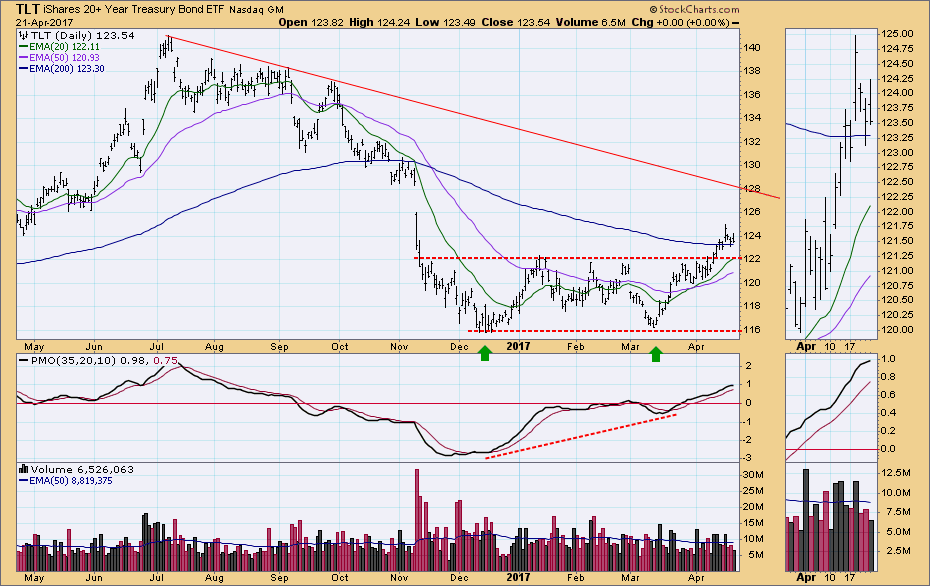
IT Trend Model: BUY as of 3/31/2017
LT Trend Model: SELL as of 11/17/2016
Last week price broke out of a trading range that was dominated buy a double bottom. This week price moved higher, managing to move above the 200EMA. Note the PMO positive divergence relative to the double price bottom. The minimum upside target for the double bottom is about 128.00, at which point overhead resistance will be encountered.
The weekly chart is bullish with the weekly PMO is above its signal line (BUY signal), and price advancing within a rising trend channel.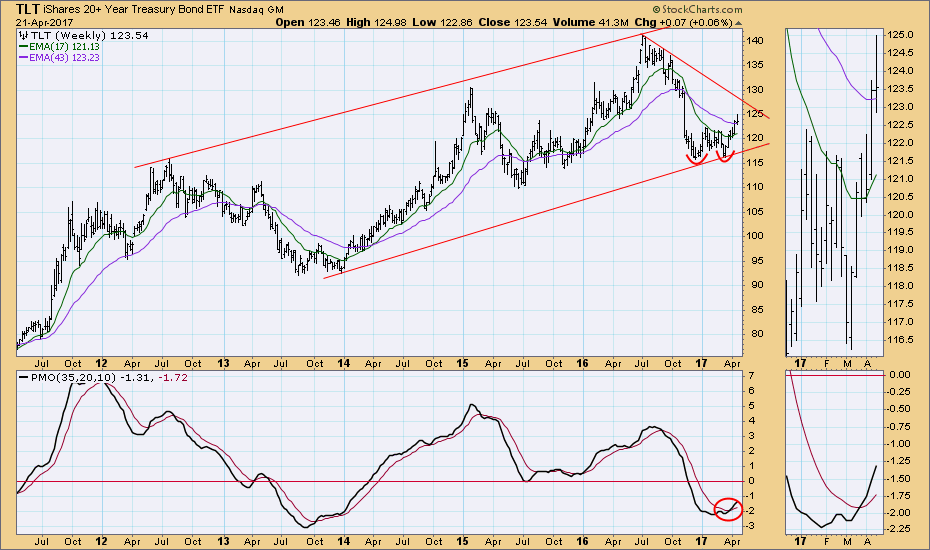
NOTE: The signal status reported herein is based upon mechanical trading model signals, specifically, the DecisionPoint Trend Model. They define the implied bias of the price index based upon moving average relationships, but they do not necessarily call for a specific action. They are information flags that should prompt chart review. Further, they do not call for continuous buying or selling during the life of the signal. For example, a BUY signal will probably (but not necessarily) return the best results if action is taken soon after the signal is generated. Additional opportunities for buying may be found as price zigzags higher, but the trader must look for optimum entry points. Conversely, exit points to preserve gains (or minimize losses) may be evident before the model mechanically closes the signal.
The DecisionPoint LIVE Shared ChartList has launched! Click on the link and you'll find webinar and blog chart spotlights. Be sure and bookmark it!
Technical Analysis is a windsock, not a crystal ball.
Happy Charting!
- Carl
