 A new Long-Term Trend Model signal triggered on Gold today. This occurs when the 50-EMA crosses above the 200-EMA. When this happens, DecisionPoint theory is that any stock, ETF, index, etc. with a 50-EMA above the 200-EMA is in a technical bull market. What does this mean? If you are in a "bull market" environment, you should expect bullish outcomes over bearish outcomes.
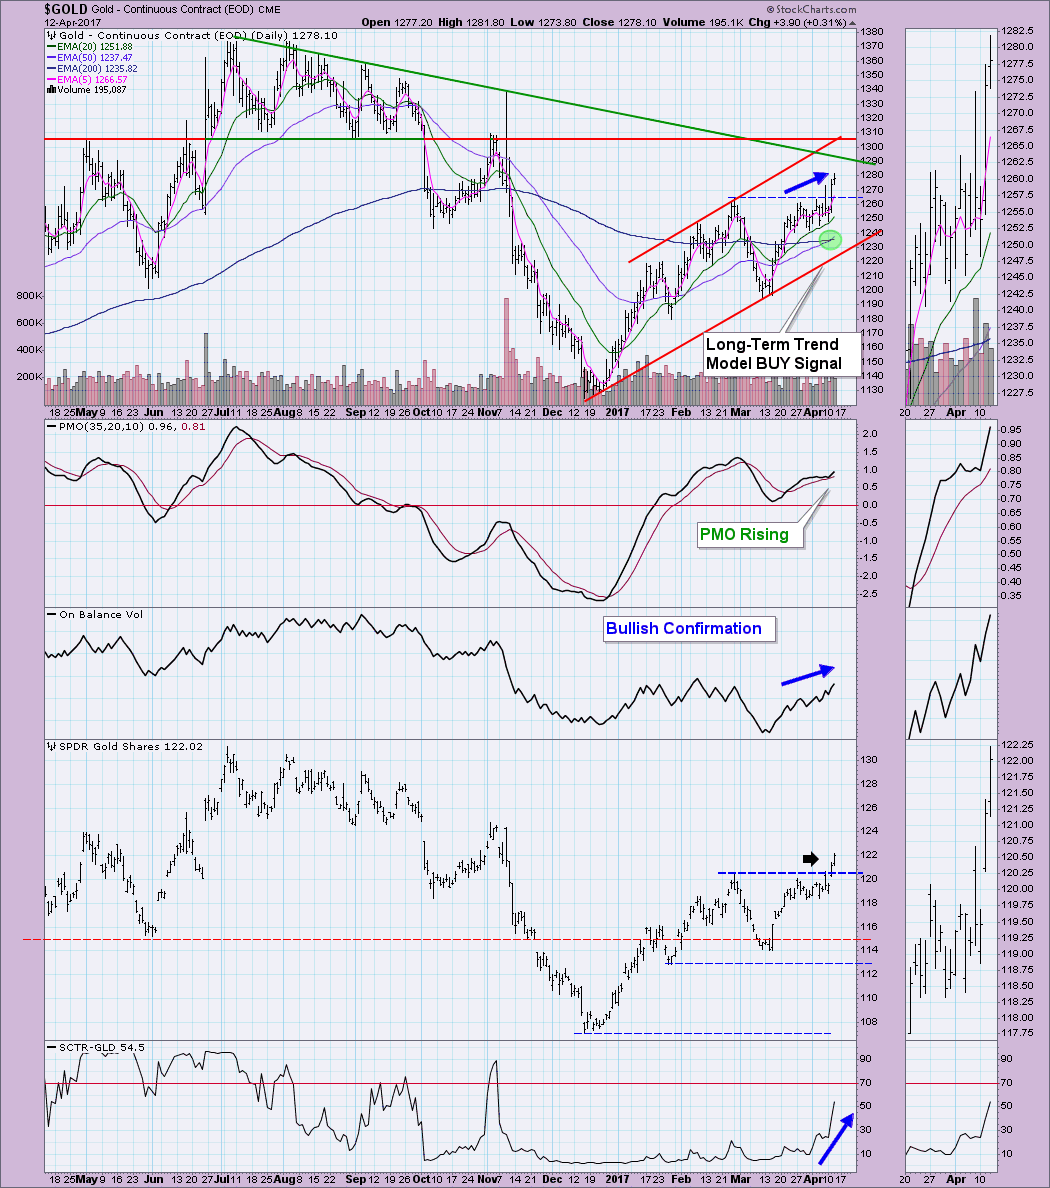
Gold happens to be in an interesting place. I have been bullish on Gold and still am to some degree. The daily chart looks good with a steeply rising Price Momentum Oscillator (PMO) and bullish confirmation of the OBV. The SCTR has a fire under it and should hit the "hot zone" above 75 soon. Gold has some serious overhead resistance to contend with. There are three separate areas of resistance. First, the most important, horizontal resistance at about 1305 that coincides with the November top and July/August/September lows. Greg Morris preaches regularly about the importance of horizontal support and resistance versus trendline resistance which is why I'm looking for a test at 1300. There is trendline resistance to worry about too. The top of the rising trend channel and the longer-term declining tops trendline. Indicators suggest we will finally see a breakout above this resistance area.
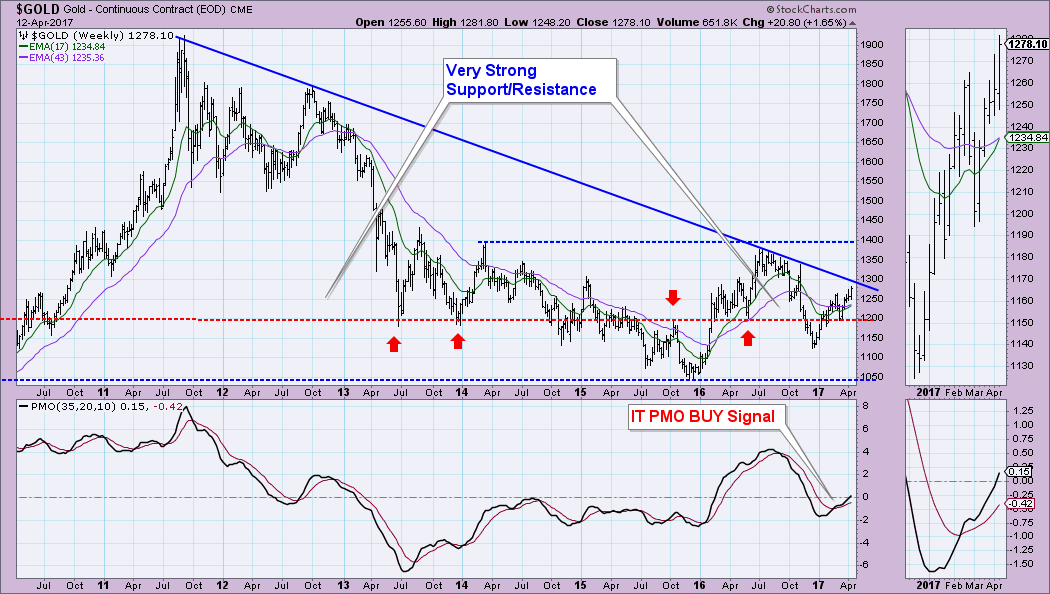
The weekly chart gives you another view of overhead resistance. Note that the declining tops line formed in 2012 has held up throughout 2016 and is about to be tested again now. I like the weekly PMO BUY signal and the 17-week EMA preparing to cross above the 43-week EMA.
Conclusion: If Gold is going to breakout, this is the time. There is uncertainty in the market which nearly always favors Gold. Indicators look good on both the daily and weekly charts too. The set-up won't get much better.
The DecisionPoint LIVE Shared ChartList is available now! Click on the link and you'll find all your favorite DP charts all annotated! Be sure and bookmark it!
Technical Analysis is a windsock, not a crystal ball.
Happy Charting!
- Erin
