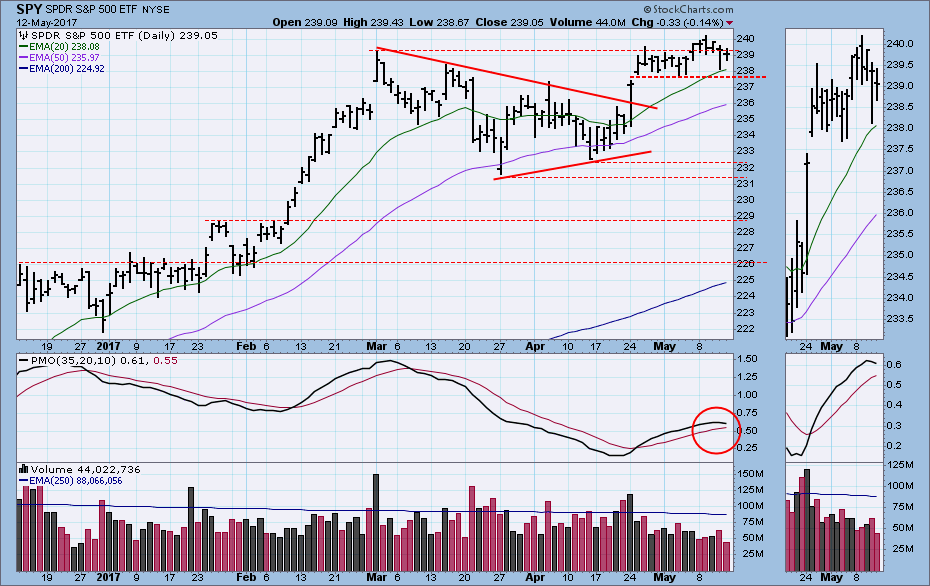
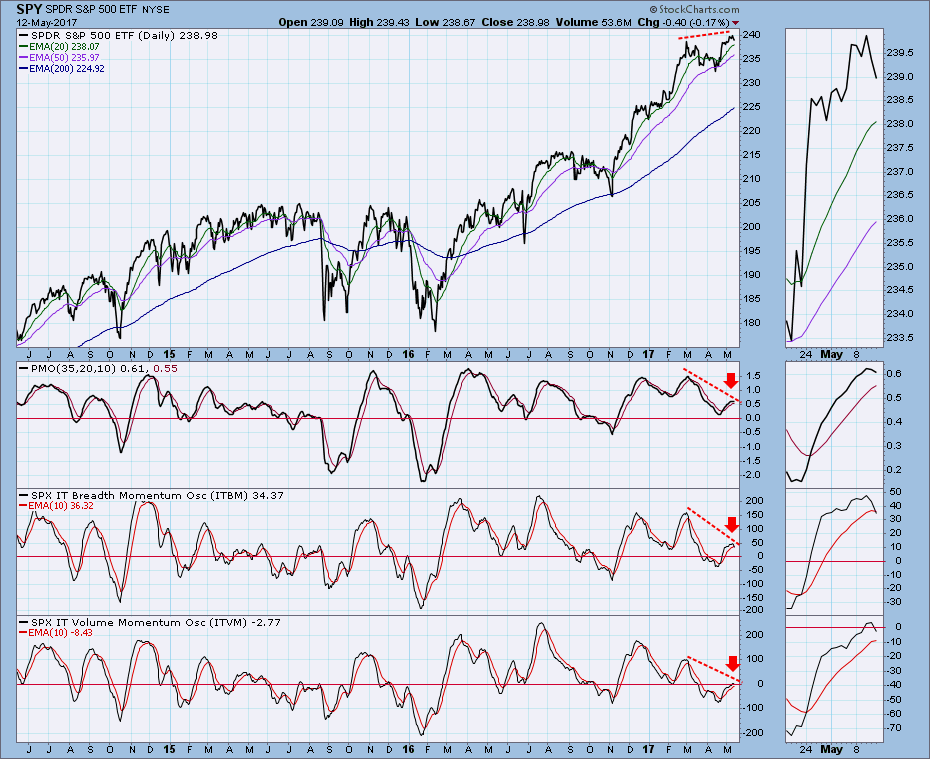
I thought that last week's breakout was the initiation of a new rally that would continue this week. But no. This week price moved back below the breakout level, but strangely this failure did not develop into a more serious breakdown either. Price just continued to churn sideways, which resulted in the PMO (Price Momentum Oscillator) turning down -- a very short-term SELL signal.
The DecisionPoint Weekly Wrap presents an end-of-week assessment of the trend and condition of the stock market (S&P 500), the U.S. Dollar, Gold, Crude Oil, and Bonds.
STOCKS
IT Trend Model: BUY as of 11/15/2016
LT Trend Model: BUY as of 4/1/2016
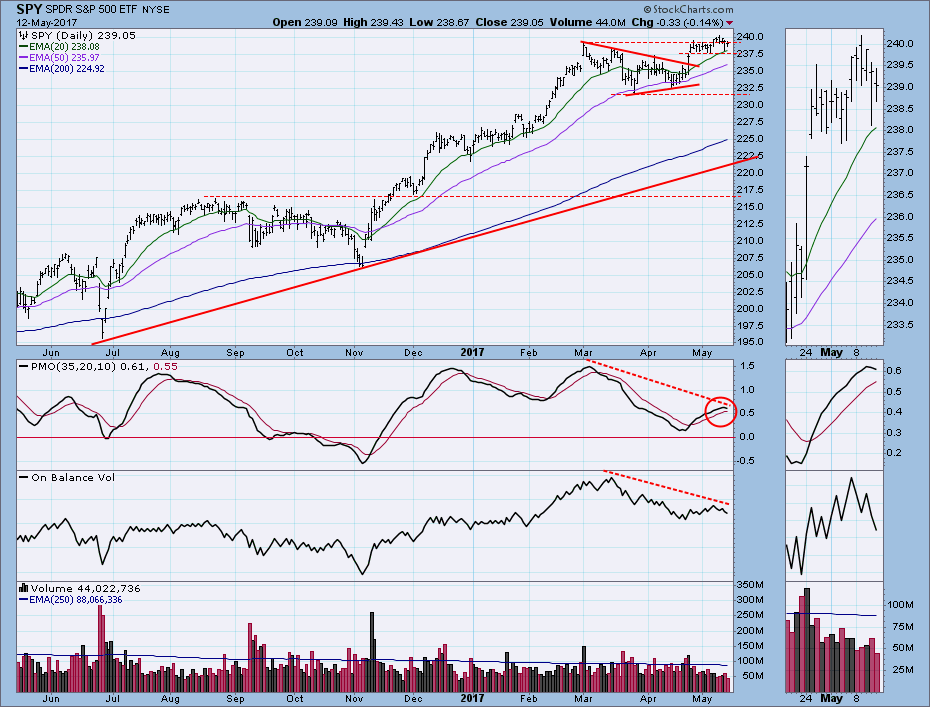
Price broke out through the top of a triangle formation in late April, but it has made virtually no progress since reaching the high set in March. There are negative divergences on OBV and on the PMO, which just topped.
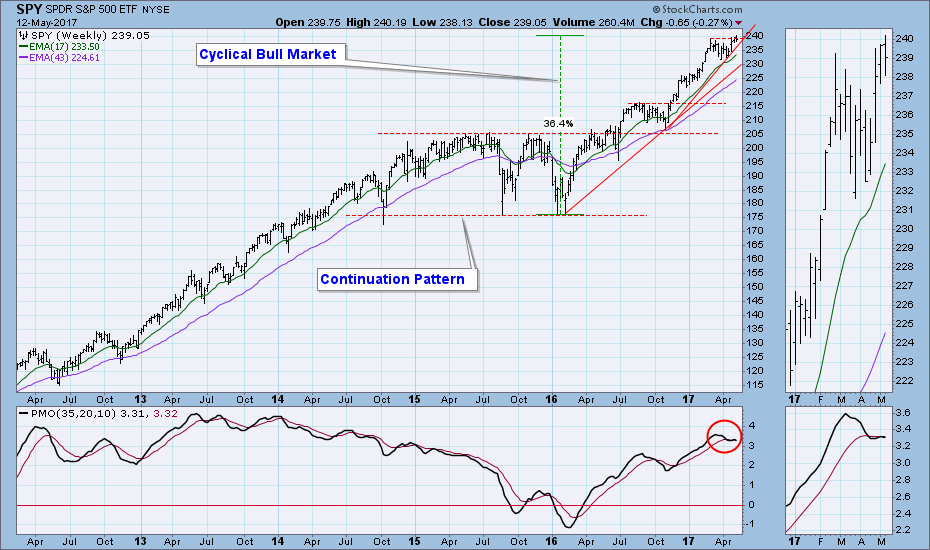
 The weekly PMO is very close to topping below the signal line, which is a very negative configuration.
Short-Term Market Indicators: There are negative divergences across the two most recent short-term tops.
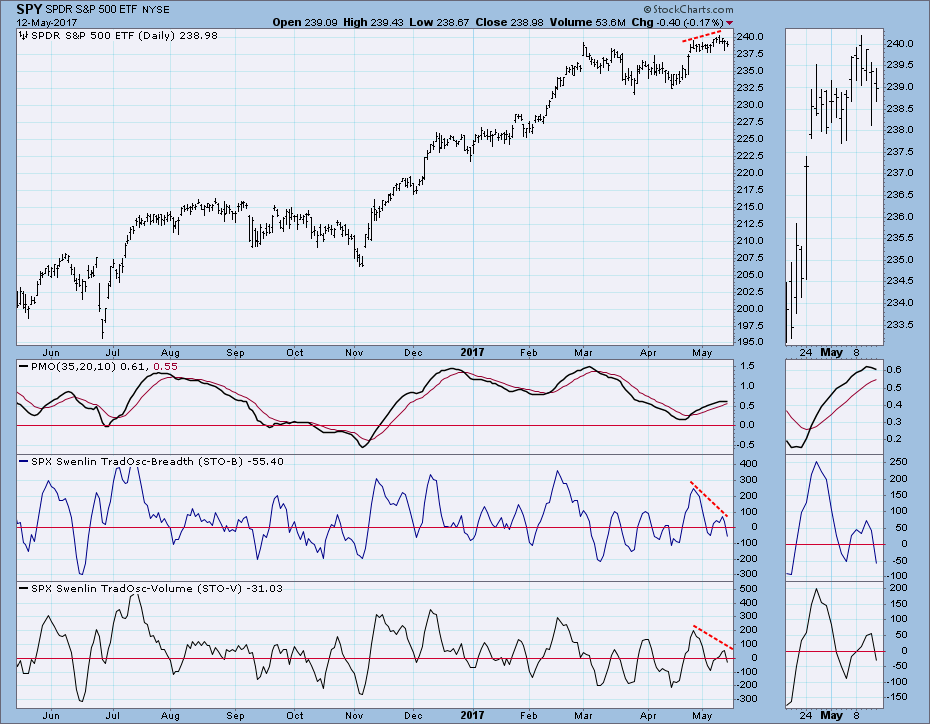
Intermediate-Term Market Indicators: More negative divergences, and the ITVM has topped very close to the zero line, emphasizing how weak volume has been.
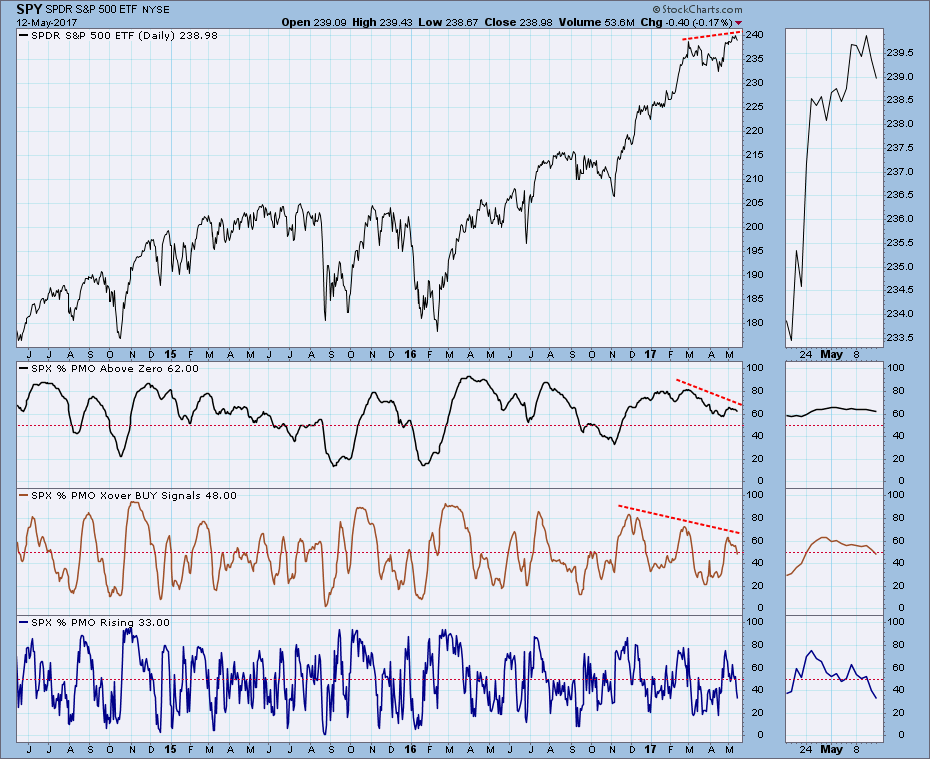
PMO Analysis: I don't usually include this chart, but I think it gives an important view of weakening internals. It shows the percentage of S&P 500 stocks whose PMOs are: (1) above zero, (2) above their signal lines (PMO crossover BUY signals), and (3) rising. The percentages are unusually low, considering that SPY is near all-time highs.
Conclusion: My optimism from last week has been considerably dampened by the market's failure to continue to rally after breaking out and making new, all-time highs. Indicators, which last week offered encouragement by being bull market oversold and rising, have now topped and have formed negative divergences against price. How can the outlook change so quickly? Well, we are positive when indicators begin moving up from relatively oversold levels -- they have plenty of room to accommodate higher prices before they start to become overbought. But the price advance has not materialized (yet?), and the indicators have now topped at levels that are still oversold by bull market standards. We don't want indicators topping while they are still oversold. It is dangerous. Because of this, I am am feeling very cautious about next week.
DOLLAR
IT Trend Model: NEUTRAL as of 3/21/2016
LT Trend Model: BUY as of 10/17/2016
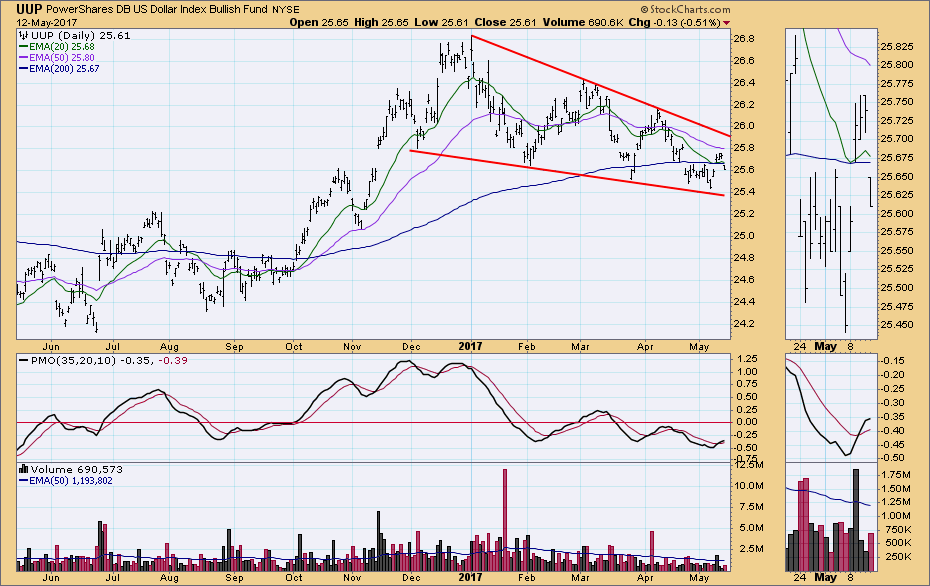
Last week I thought there was a good chance that price would drop down through the bottom of the falling wedge formation, but a sharp bounce on Monday and Tuesday saved the day. Unfortunately, price broke down again on Friday, and we may see support challenged again next week.
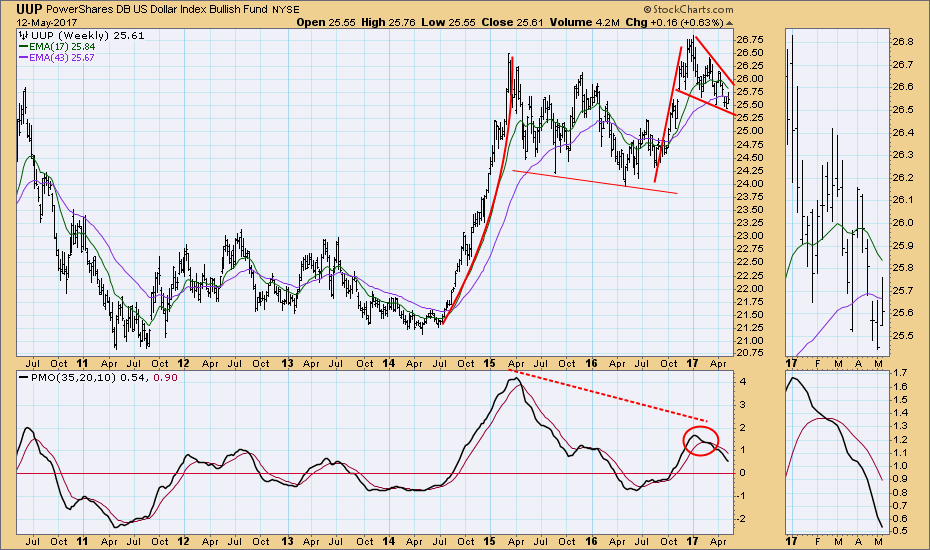
The bullish pennant formation still holds, but the weekly PMO is falling. There is a PMO negative divergence.
GOLD
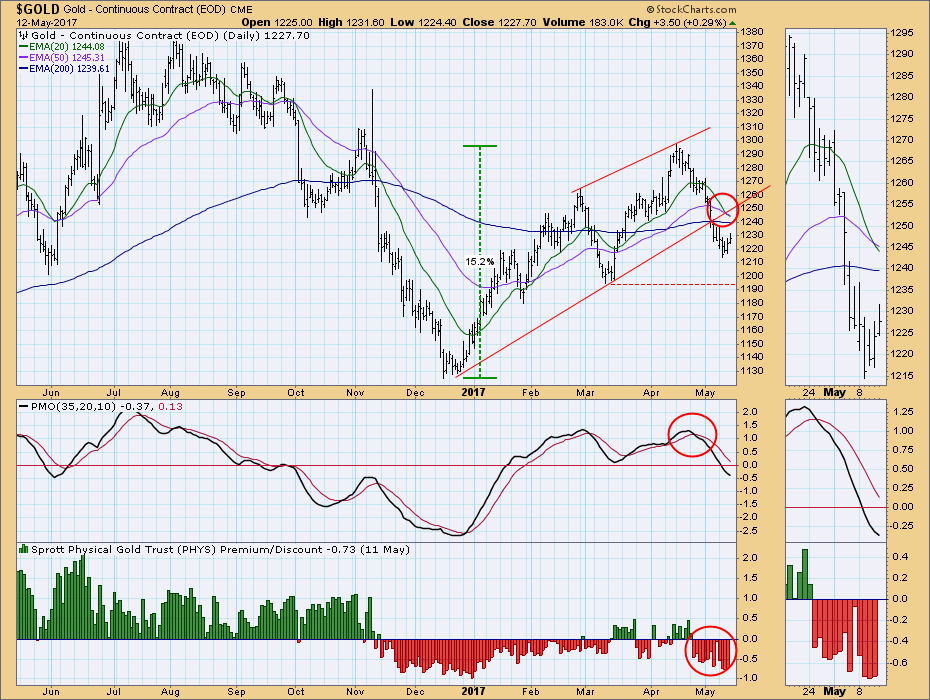
IT Trend Model: NEUTRAL as of 5/11/2017
LT Trend Model: BUY as of 4/12/2017
On Thursday gold generated an IT Trend Model NEUTRAL signal, as the 20EMA crossed down through the 50EMA. Note that a SELL signal isn't generated unless the 50EMA is below the 200EMA at the time of the 20/50EMA crossover.
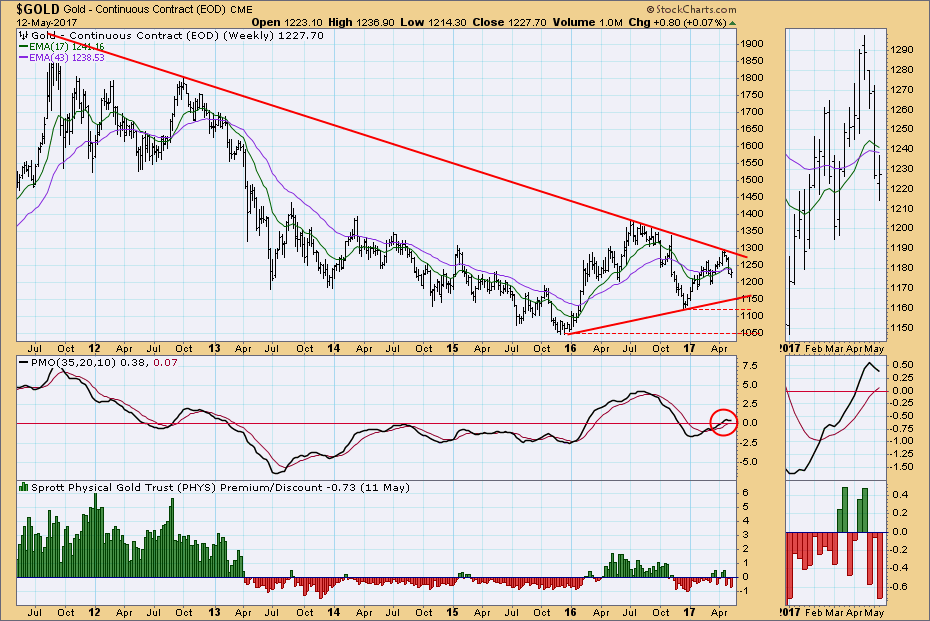
The weekly chart shows that price is in the middle of a triangle formation, and the bottom of the triangle is a reasonable downside target.
CRUDE OIL (USO)
IT Trend Model: NEUTRAL as of 3/8/2017
LT Trend Model: SELL as of 3/9/2017
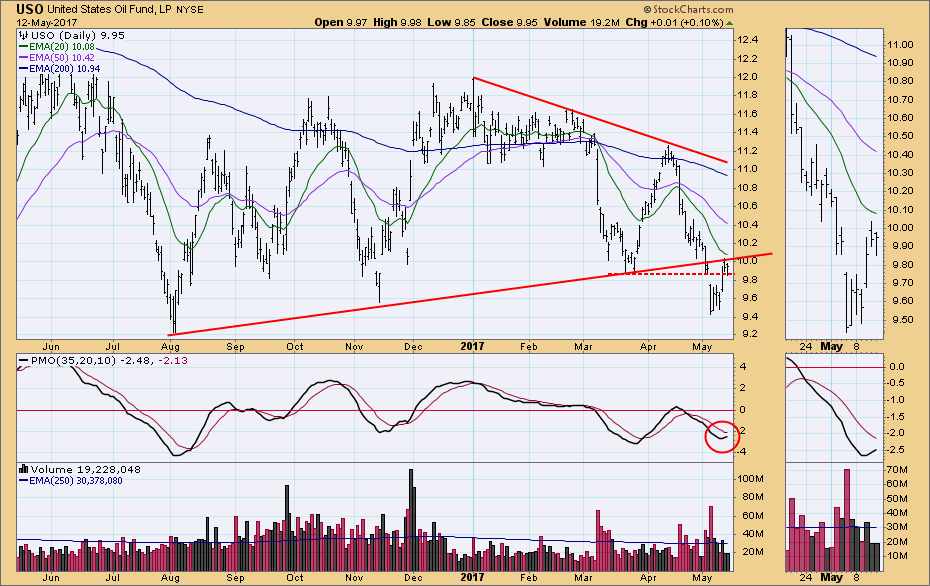
The annotations on the USO daily chart are possibly more complex than they need to be. Since the price bottom has also resulted in a PMO bottom, chances are that price is headed back up to the top of the trading range.
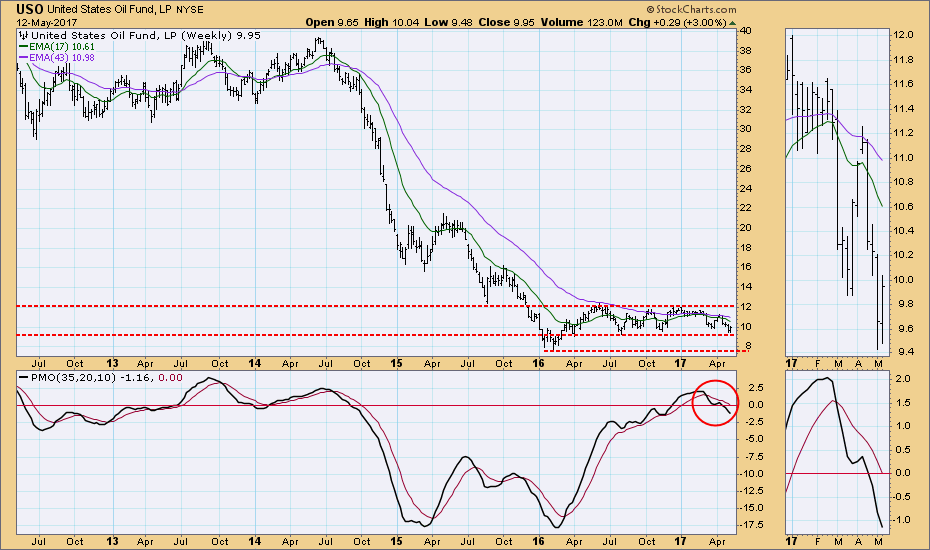
The trading range issue is more apparent on the weekly chart.
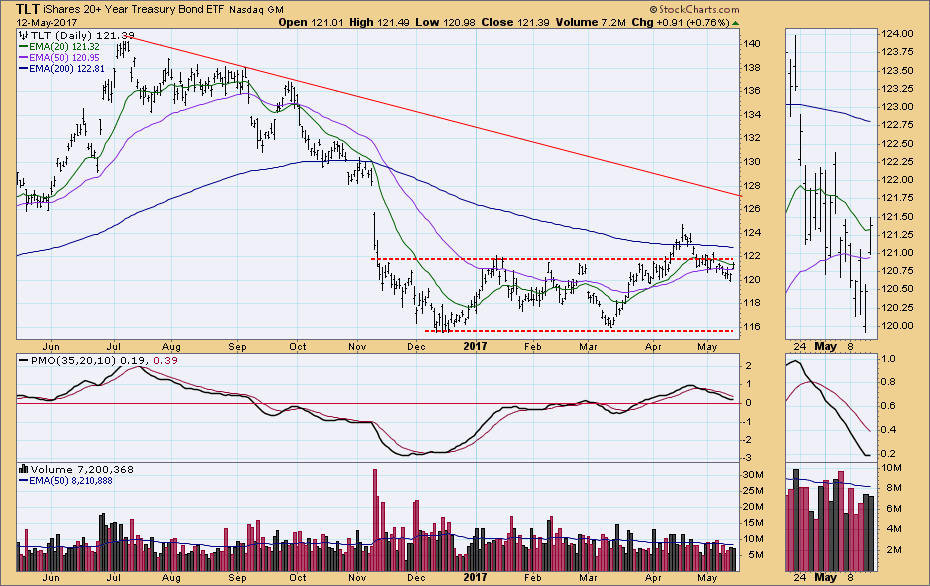
BONDS (TLT)
IT Trend Model: BUY as of 3/31/2017
LT Trend Model: SELL as of 11/17/2016
After a week of correcting, price bounced up nicely on Friday. The daily PMO will bottom next week if price continues higher.
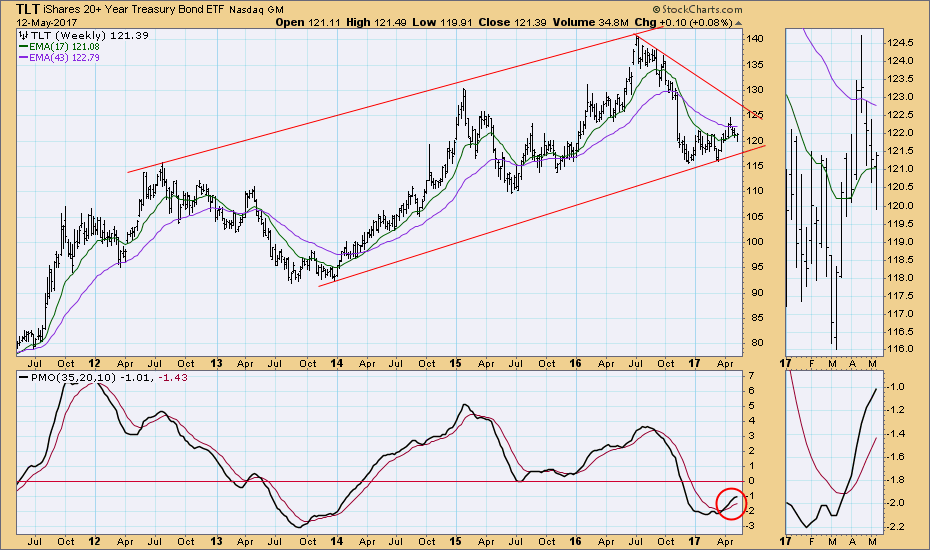
The weekly PMO is still rising, and price closed near the high for the week.
NOTE: The signal status reported herein is based upon mechanical trading model signals, specifically, the DecisionPoint Trend Model. They define the implied bias of the price index based upon moving average relationships, but they do not necessarily call for a specific action. They are information flags that should prompt chart review. Further, they do not call for continuous buying or selling during the life of the signal. For example, a BUY signal will probably (but not necessarily) return the best results if action is taken soon after the signal is generated. Additional opportunities for buying may be found as price zigzags higher, but the trader must look for optimum entry points. Conversely, exit points to preserve gains (or minimize losses) may be evident before the model mechanically closes the signal.
The DecisionPoint LIVE Shared ChartList has launched! Click on the link and you'll find webinar and blog chart spotlights. Be sure and bookmark it!
Technical Analysis is a windsock, not a crystal ball.
Happy Charting!
- Carl
Helpful DecisionPoint Links:
DecisionPoint Shared ChartList and DecisionPoint Chart Gallery
Price Momentum Oscillator (PMO)
Swenlin Trading Oscillators (STO-B and STO-V)
