Last week I said that I was expecting the market to do a little more work on the downside before the bull market resumed, but the market had other ideas. Prices continued to rally, and on Thursday SPY broke to new, all-time highs. Volume expanded on that day, but it was still well below the one-year average of daily volume. Below we'll look at evidence that fewer stocks are participating in the rally.
The DecisionPoint Weekly Wrap presents an end-of-week assessment of the trend and condition of the stock market (S&P 500), the U.S. Dollar, Gold, Crude Oil, and Bonds.
STOCKS
IT Trend Model: BUY as of 11/15/2016
LT Trend Model: BUY as of 4/1/2016
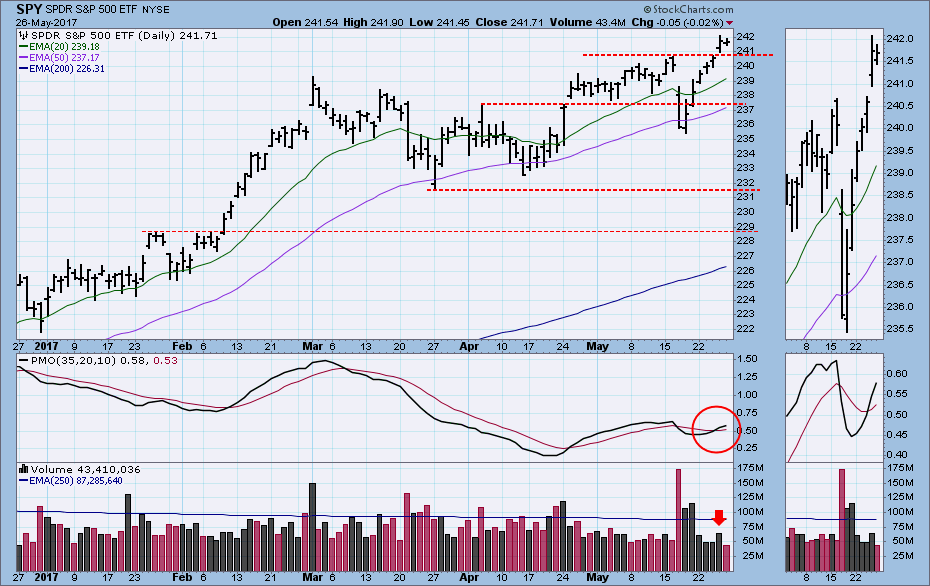
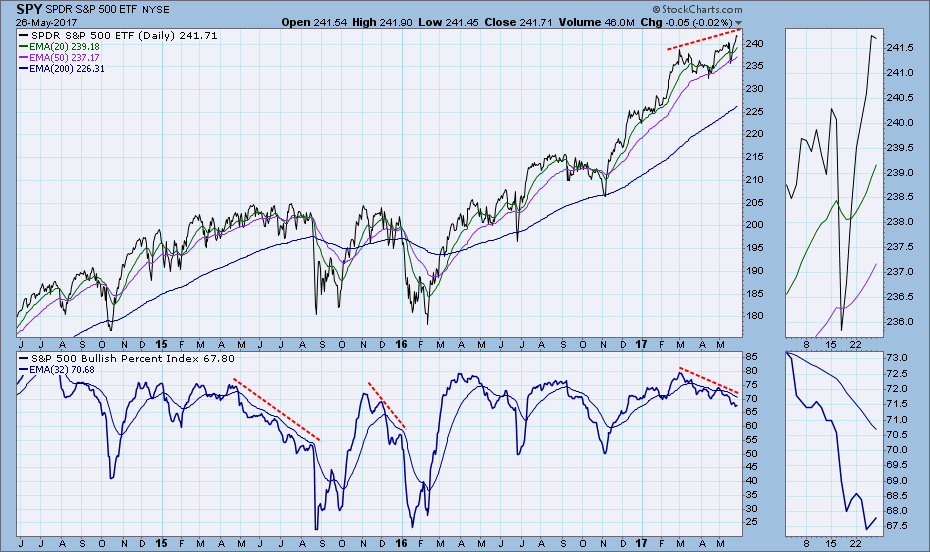
On the SPY daily chart price is overbought in terms of its distance from the 200EMA and the rising trend line drawn from the February 2016 low. And, while price keeps moving higher, the overbought condition is impeding upward progress.

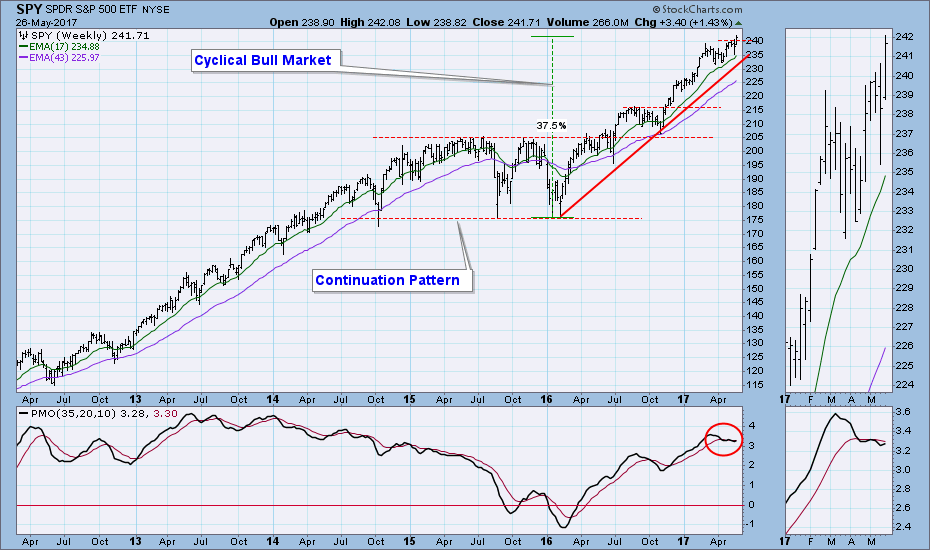
The weekly PMO turned up this week, but I have a hard time seeing a robust rise in the weekly PMO while overbought conditions exist.
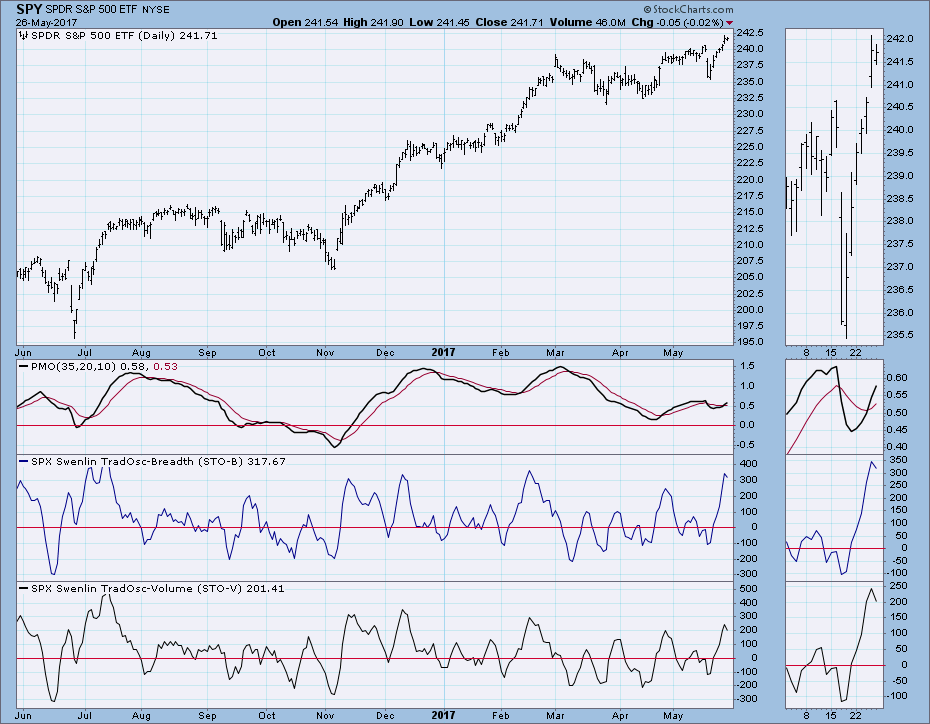
Short-Term Market Indicators: Both of our short-term indicators are overbought and have topped. The STO-B (breadth) is near the top of its three-year range, and the STO-V (volume) is near the top of its one-year range. Nevertheless, this condition does not necessarily call for an immediate price top -- price could move higher for a couple of weeks before it corrects or consolidates. In the meantime the indicators should move back toward the neutral zone.
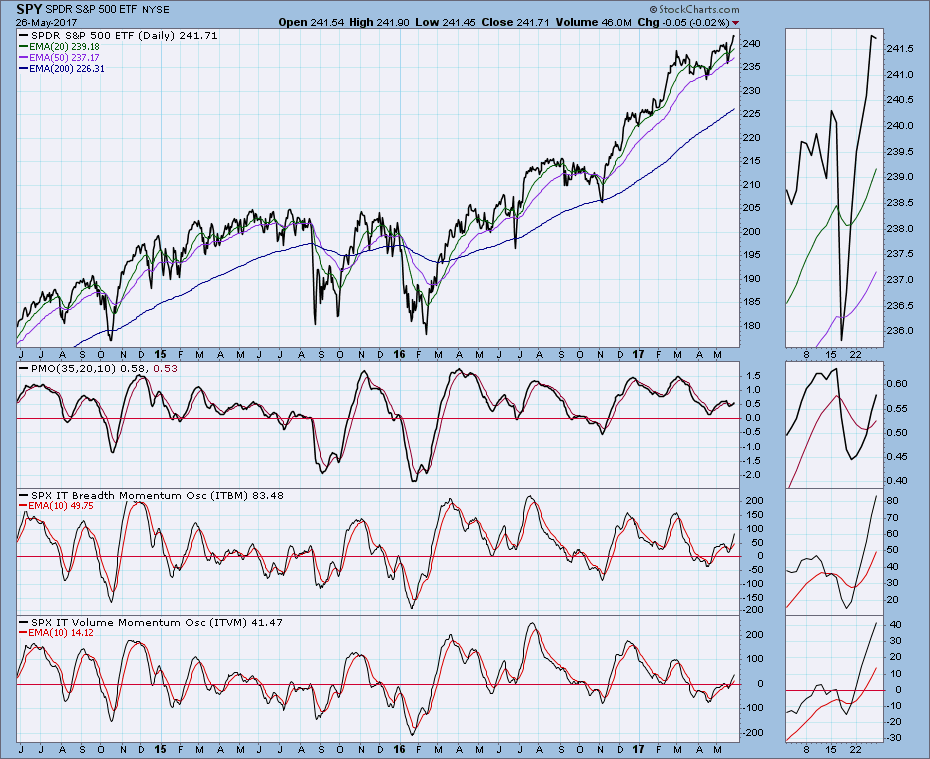
Intermediate-Term Market Indicators: The ITBM and ITVM are both rising in neutral territory, and they present no obstacle to price moving higher for a few more weeks.
 Below is a chart with a longer-term perspective and it paints a less optimistic picture. The Bullish Percent Index shows the percentage of S&P 500 stocks that have point and figure BUY signals. Since the high reading at the end of February the BPI has fallen over 12 points, while price has moved to record highs. This means that there are fewer stocks participating in the rally now than there were three months ago. The two more severe divergences in 2015 show the kind of trouble to which this situation can lead. Q: How can price advance even though fewer stocks are participating? A: The larger-cap stocks carry more of the load.
Conclusion: We are riding a cyclical bull market within a secular bull market. My opinion is that the cyclical bull market began in February 2016, so there should be more than a year before the next bear market begins. That is something of a WAG (wild, audacious guess) based upon a textbook template of a 'typical' market cycle, which lasts four years from trough to trough. The bull market runs the first two-and-a-half years, and the remaining year-and-a-half is reserved for the bear market. We would be hard pressed to find recent, real-life examples that fit this template, but it is a handy rule of thumb.
As for the more immediate future, our short- and intermediate-term indicators suggest that we will see a few more weeks of rally before another correction/consolidation. Volume has been less than robust for at least a year, and participation has been fading since February. The bull market can overcome these issues for longer than we might believe, but we need to be aware of them.
DOLLAR
IT Trend Model: NEUTRAL as of 3/21/2016
LT Trend Model: SELL as of 5/24/2017
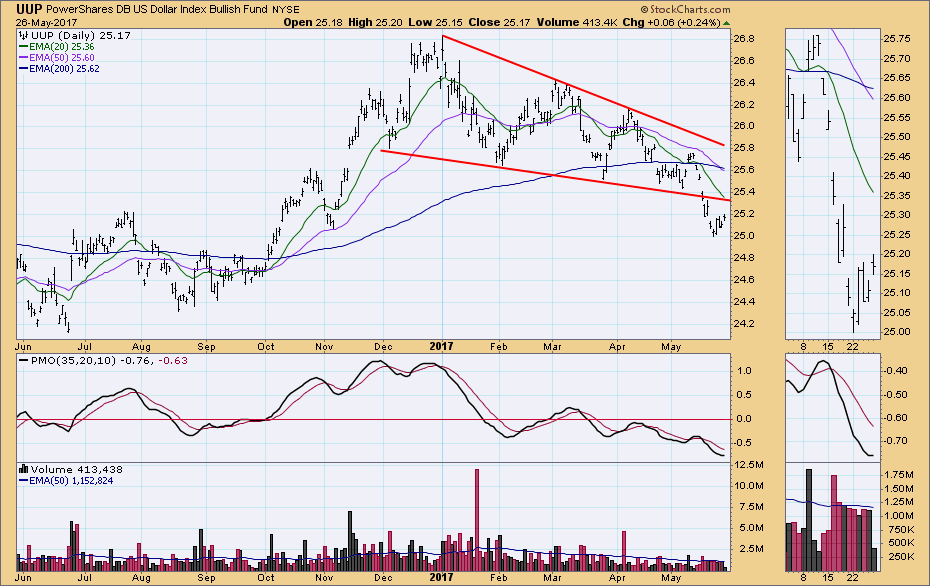
After last week's breakdown, UUP met the technical expectation and bounced up toward the point of breakdown. On Thursday the 50EMA crossed down through the 200EMA, generating a LT Trend Model SELL signal.
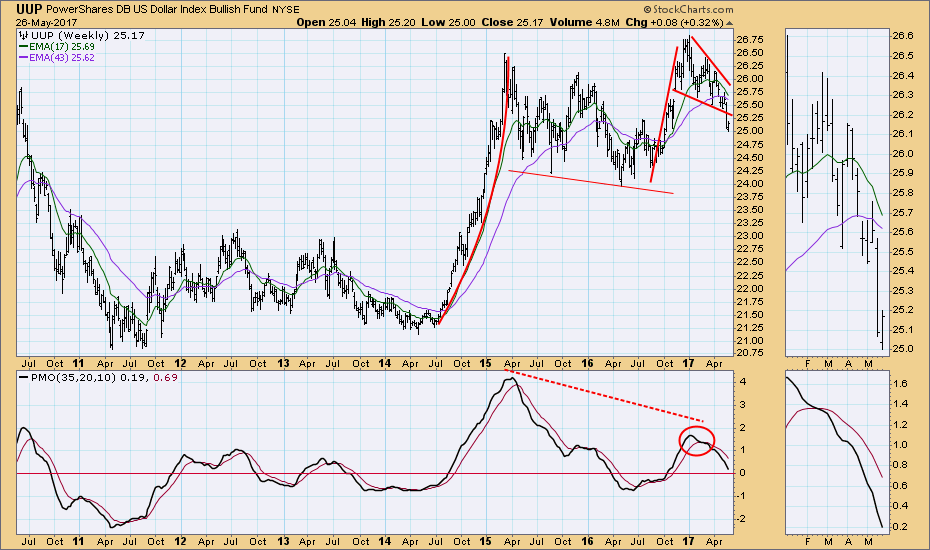
The UUP weekly chart maintains a negative picture with the weekly PMO still falling.
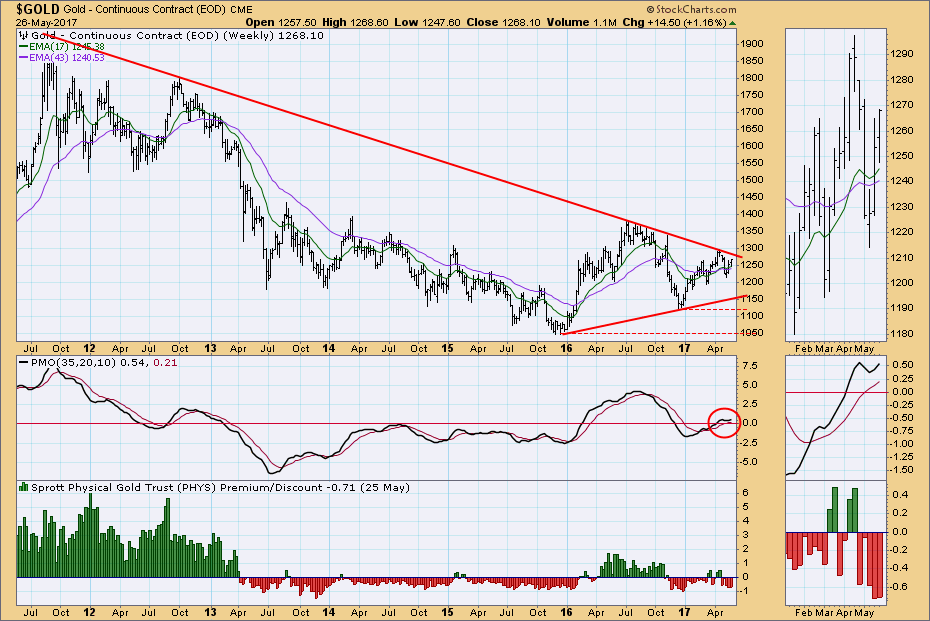
GOLD
IT Trend Model: BUY as of 5/22/2017
LT Trend Model: BUY as of 4/12/2017
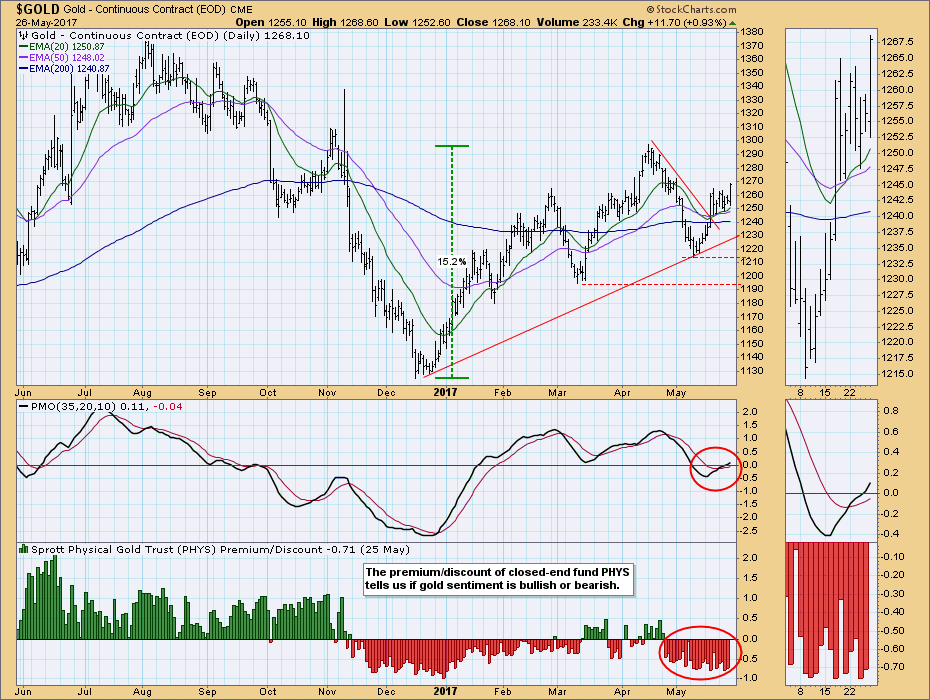
After last week's sharp advance, gold consolidated until Friday, at which time it broke upward again. Sentiment is still bearish.
Gold's weekly PMO continued to rise, and it appears that another attempt to break out of the triangle formation is in the cards.
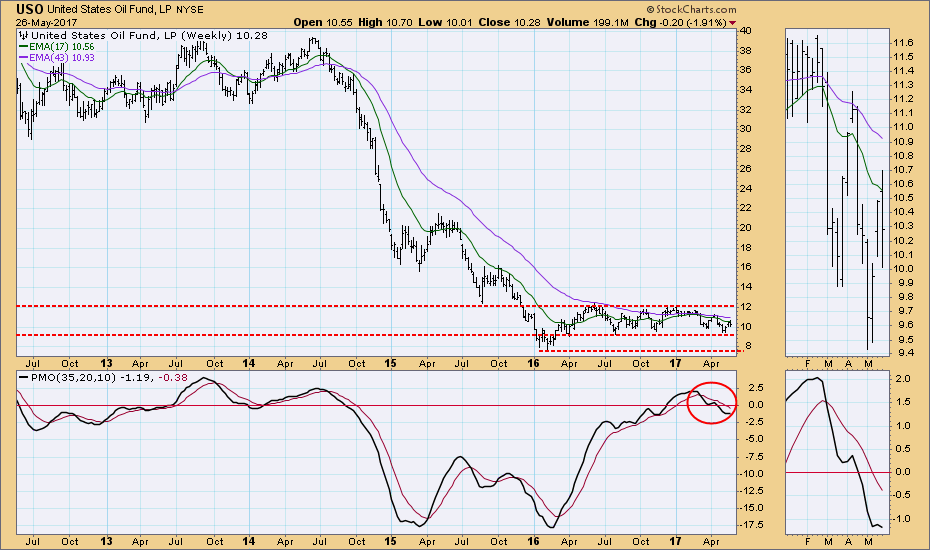
CRUDE OIL (USO)
IT Trend Model: NEUTRAL as of 3/8/2017
LT Trend Model: SELL as of 3/9/2017
On Thursday, in a one-day drop of over -5%, USO broke down through a short-term rising trend line on news that OPEC decided not to deepen their current production cut. Note the series of lower tops on the one-year chart below. Also note the number of large one-day drops preceding this week's, which was the third in three months.
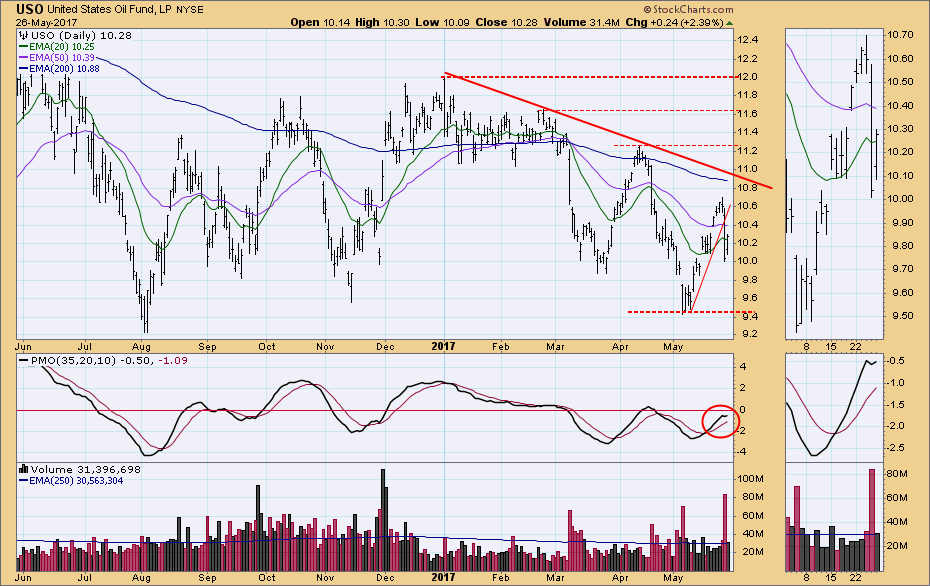
Last week I thought it possible that price would move to the top of the trading range, but that looks less likely now that the weekly PMO has topped again.
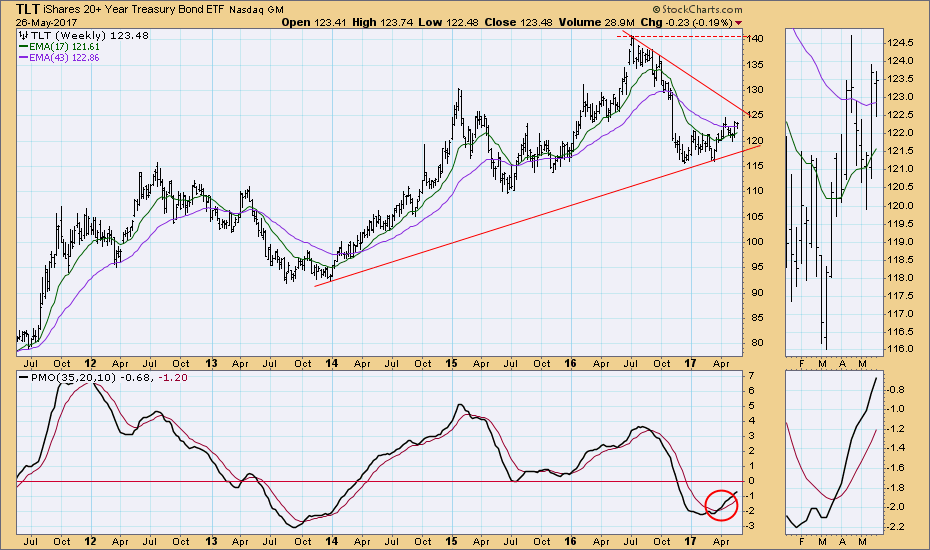
BONDS (TLT)
IT Trend Model: BUY as of 3/31/2017
LT Trend Model: SELL as of 11/17/2016
Last week I mentioned a bullish 'saucer with handle' formation, and I decided to emphasize it this week with annotations. The EMAs are rising, and if price continues higher, an LT Trend Model BUY signal will result (50EMA crossing up through the 200EMA).
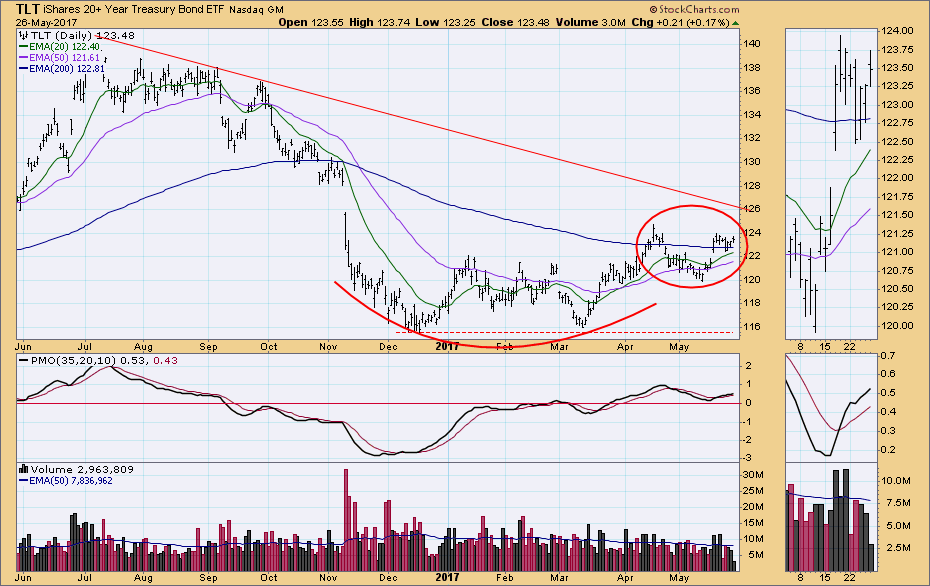
The weekly TLT chart remains positive, with the weekly PMO rising above its signal line, and price moving toward the top of a triangle formation.
**Don't miss the DecisionPoint Alert Daily Commentary! Go to the "Notify Me" box toward the end of this blog page to be notified as soon as it is published at the end of the market day.**
Technical Analysis is a windsock, not a crystal ball.
Happy Charting!
- Carl
NOTE: The signal status reported herein is based upon mechanical trading model signals, specifically, the DecisionPoint Trend Model. They define the implied bias of the price index based upon moving average relationships, but they do not necessarily call for a specific action. They are information flags that should prompt chart review. Further, they do not call for continuous buying or selling during the life of the signal. For example, a BUY signal will probably (but not necessarily) return the best results if action is taken soon after the signal is generated. Additional opportunities for buying may be found as price zigzags higher, but the trader must look for optimum entry points. Conversely, exit points to preserve gains (or minimize losses) may be evident before the model mechanically closes the signal.
Helpful DecisionPoint Links:
DecisionPoint Shared ChartList and DecisionPoint Chart Gallery
Price Momentum Oscillator (PMO)
Swenlin Trading Oscillators (STO-B and STO-V)
